
The Maester report
Every run of Invoke-Maester writes an HTML report and opens it in your browser. It is one file with nothing
to install: you can email it, attach it to a ticket or publish it from a pipeline, and it works offline.
A run can produce hundreds of results. A list that long tells you what is wrong, but not where to start. The report is built around the questions you ask after a run, in the order you ask them:
- How is my tenant doing?
- What should I fix first?
- What changed since last time?
- How do I fix this one?
- How does this map to the benchmark my auditor asks about?
Each section below answers one of them. The pictures are from the demo report, which is filled with sample results for Contoso. Select a picture to open that view in the demo and try it yourself.
Finding your way around
Section titled “Finding your way around”The menu on the left has the pages that cover the whole run at the top, then Products and Frameworks, then one row for each pack in the run, and Run details at the bottom. A red number beside a row is how many of its tests failed.
The bar across the top is the same on every page:
- Search (Ctrl+K or ⌘K) finds a test by its ID or title, a framework control or an ATT&CK technique.
- Ask AI copies the results as text and opens a new chat to paste them into. Nothing is sent for you and nothing goes into the link, so you choose what to share and with which assistant.
- Export prints the report or saves it as a PDF, and gives you the results as a table for Excel, as Markdown for a wiki or ticket, or the failures as CSV.
- The moon or sun switches between light and dark.
Overview
Section titled “Overview”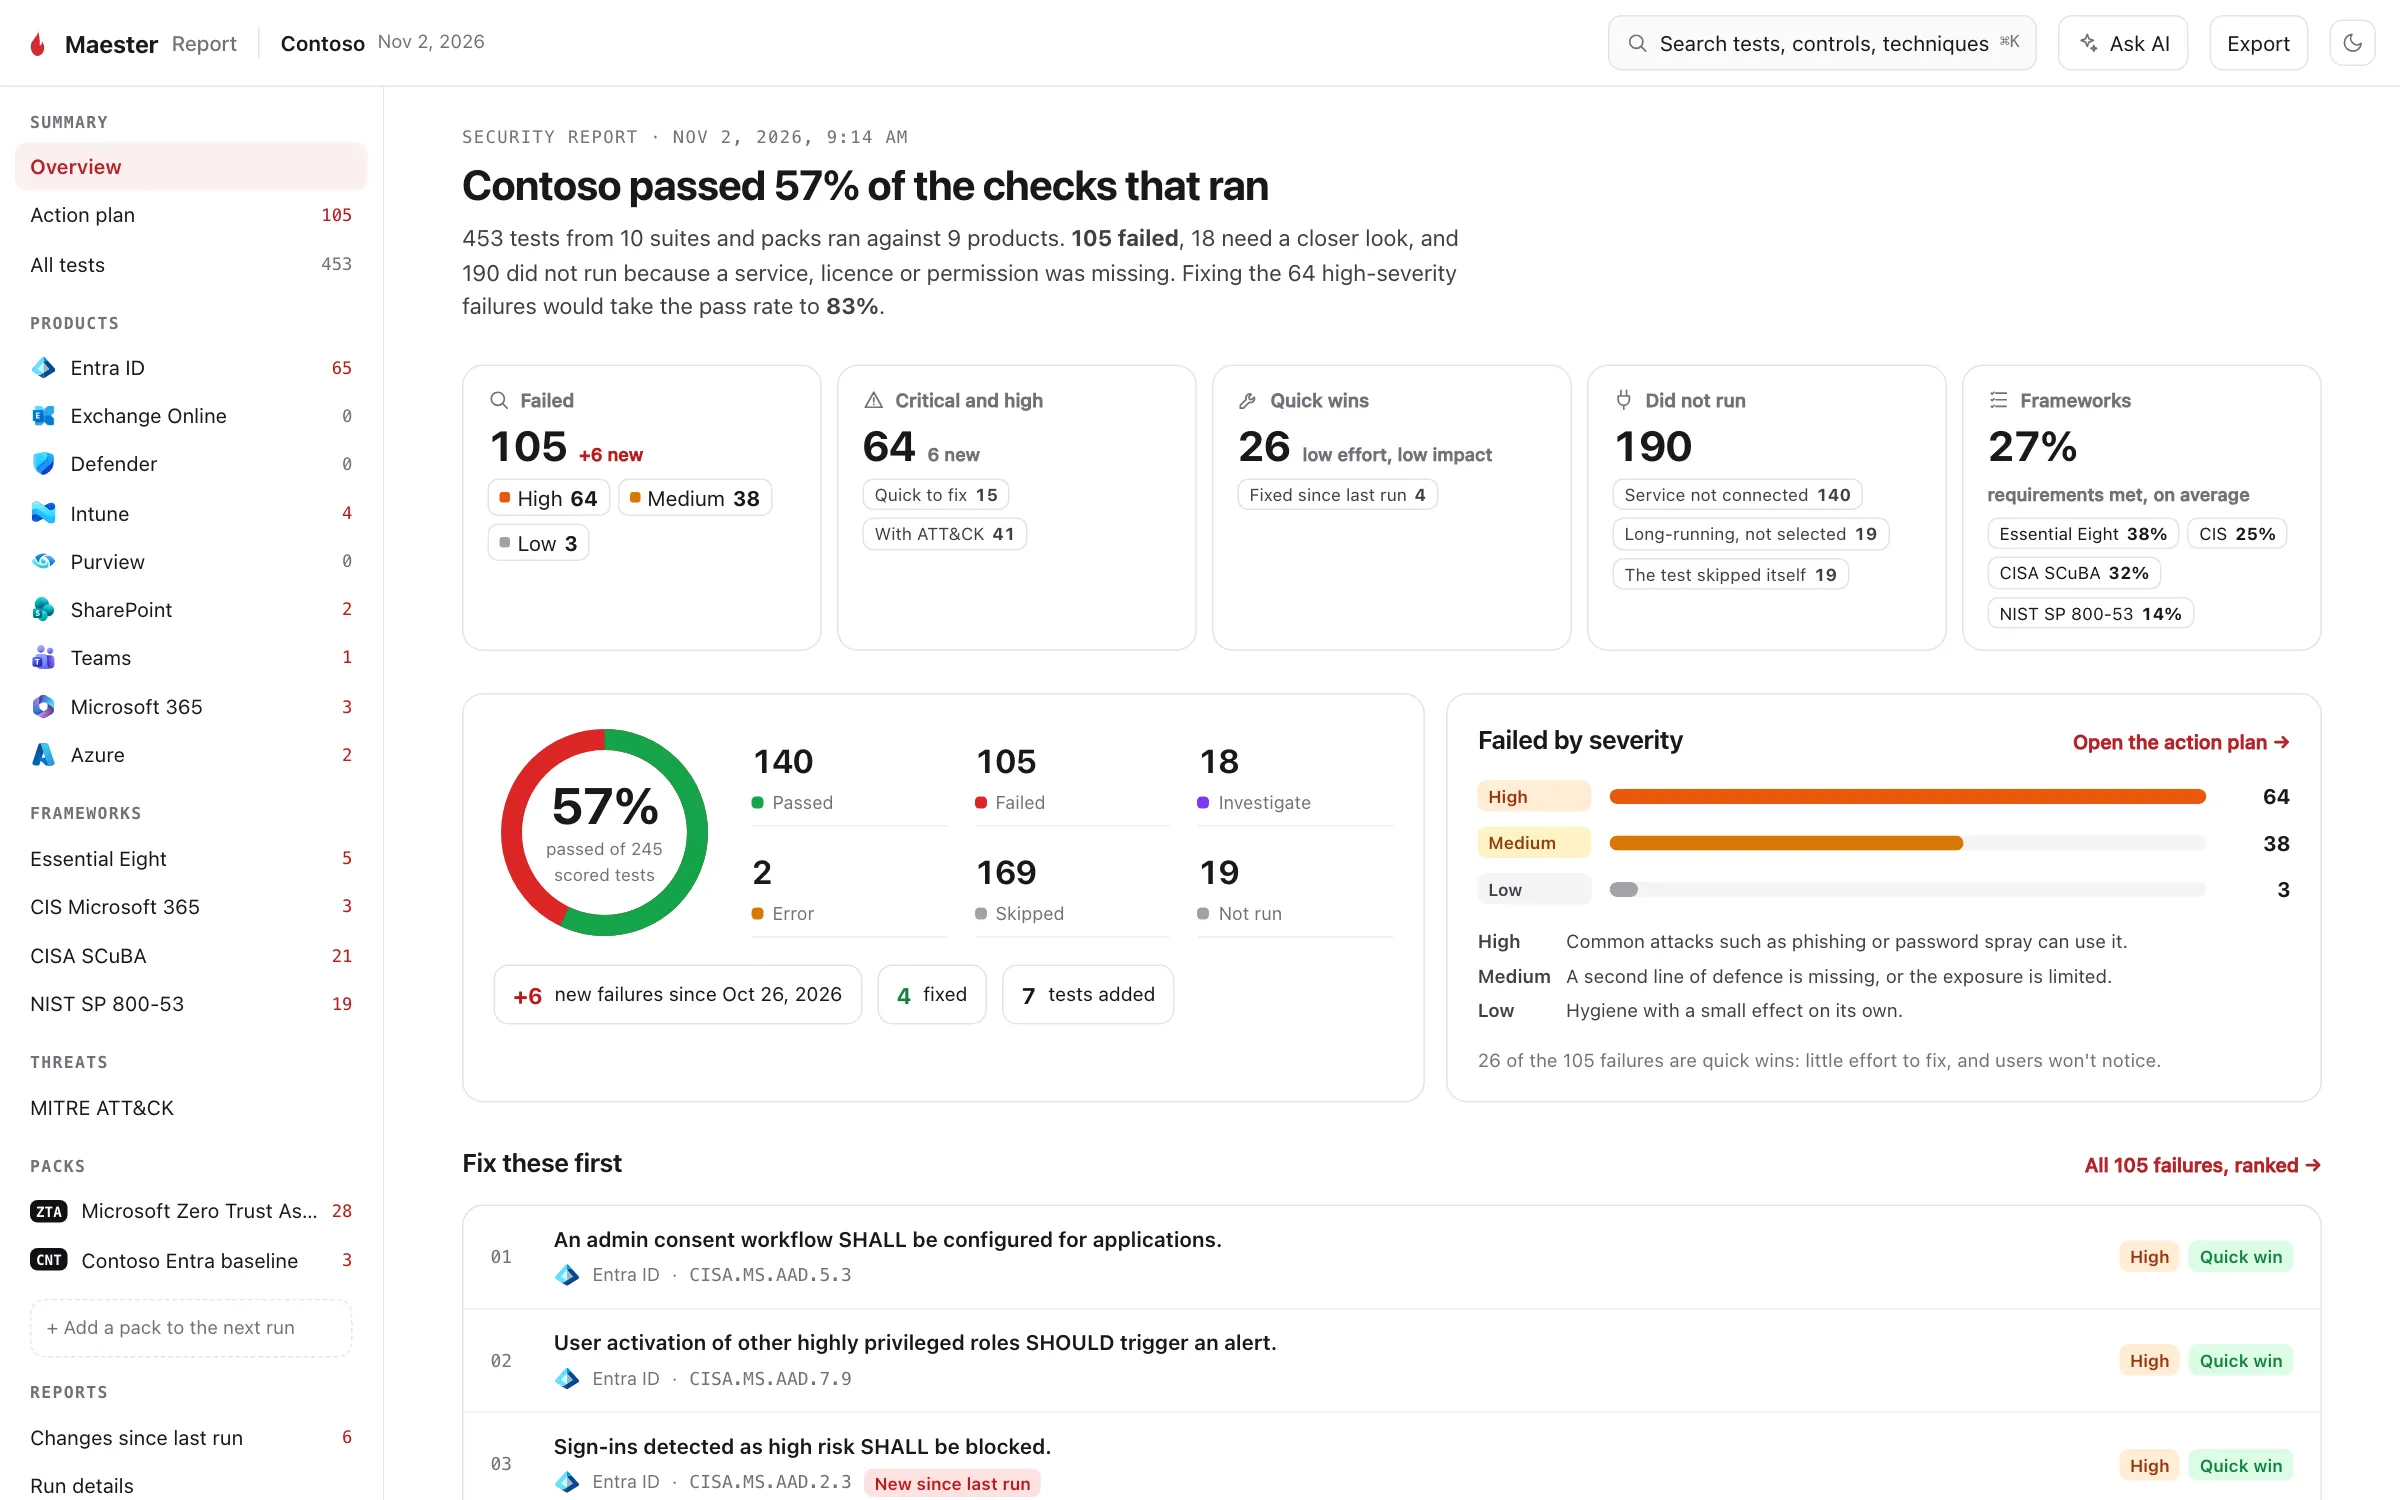
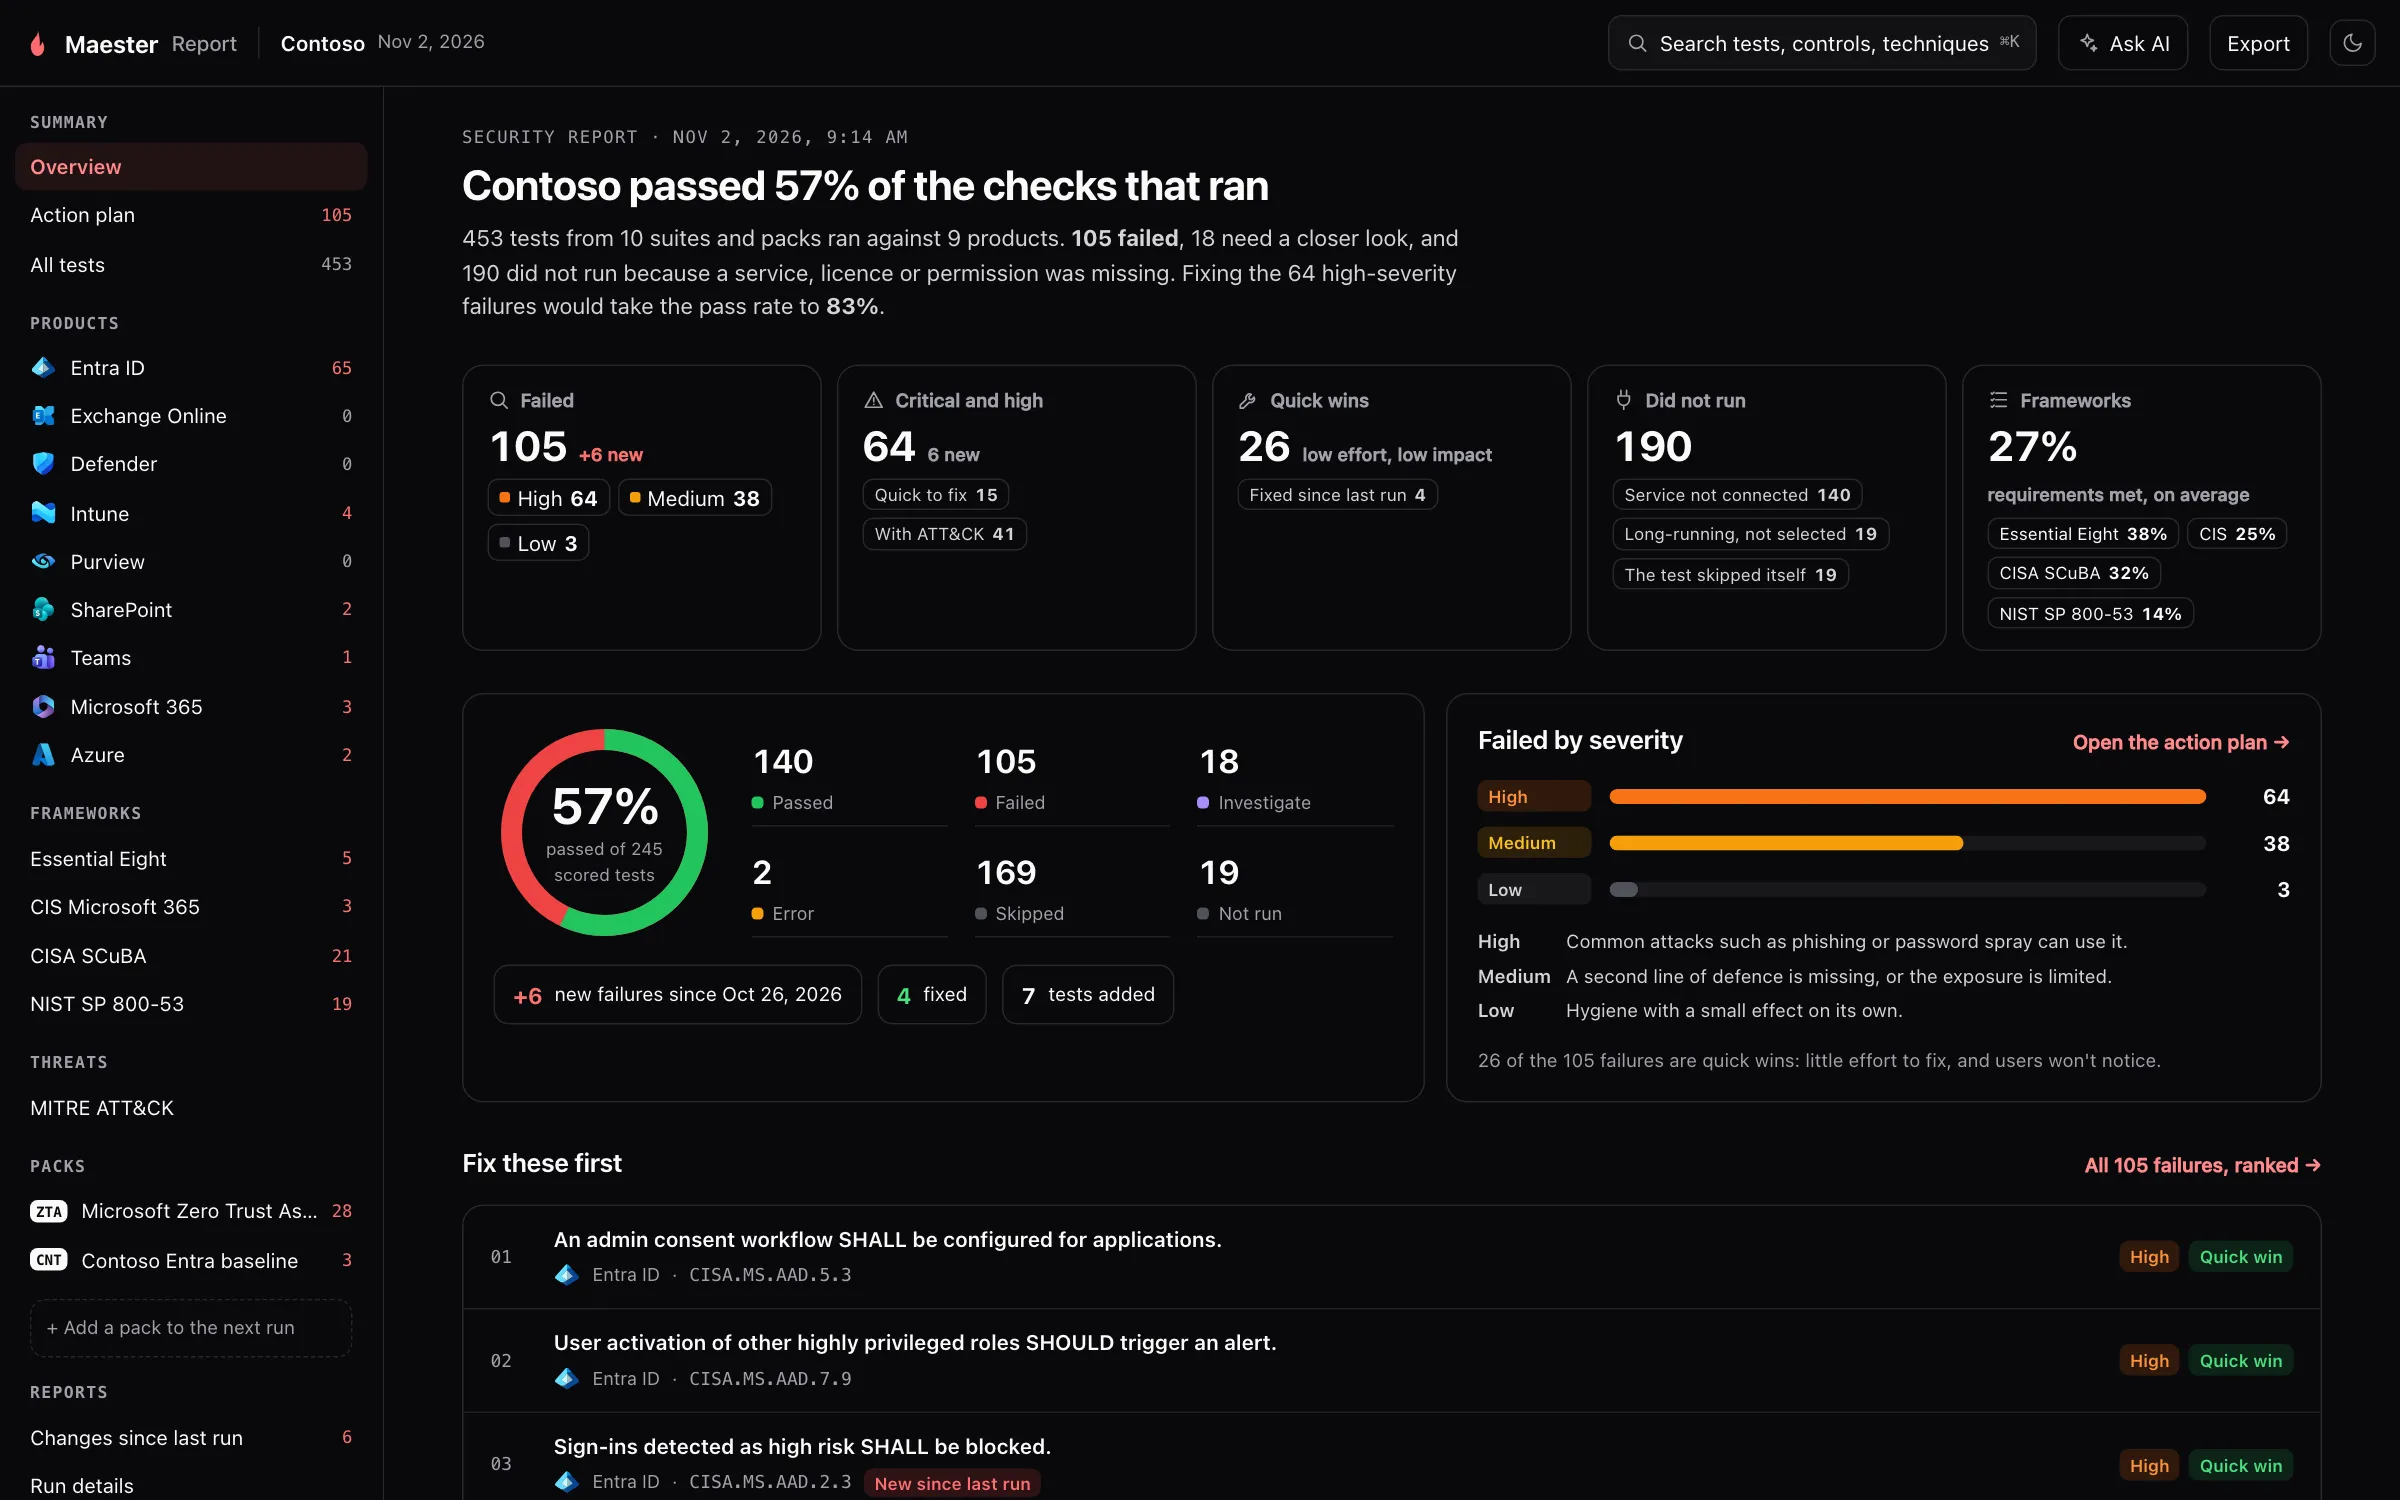
What it is for. The first page says how the run went, in one sentence and a handful of numbers.
Why we built it. Most people who open a report have a minute, and some of them are not the person who will fix anything. They need a fair summary before they need a list.
How it helps.
- The headline gives the pass rate of the tests that ran, and what fixing the high-severity failures would take it to.
- The cards break the run down: failures by severity, quick wins, what was fixed since last run, and the average share of framework requirements met.
- Did not run says why tests were left out (a service that was not connected, long-running tests not selected and so on), so a good score is never hiding tests that never ran.
- The pass rate of the last ten runs shows whether you are heading the right way.
- Fix these first lists the top of the action plan, so you can start without leaving the page.
Further down, the overview shows each product, each framework, the security areas with the most failures and the objects behind the failures. Each one opens its own page.
Action plan
Section titled “Action plan”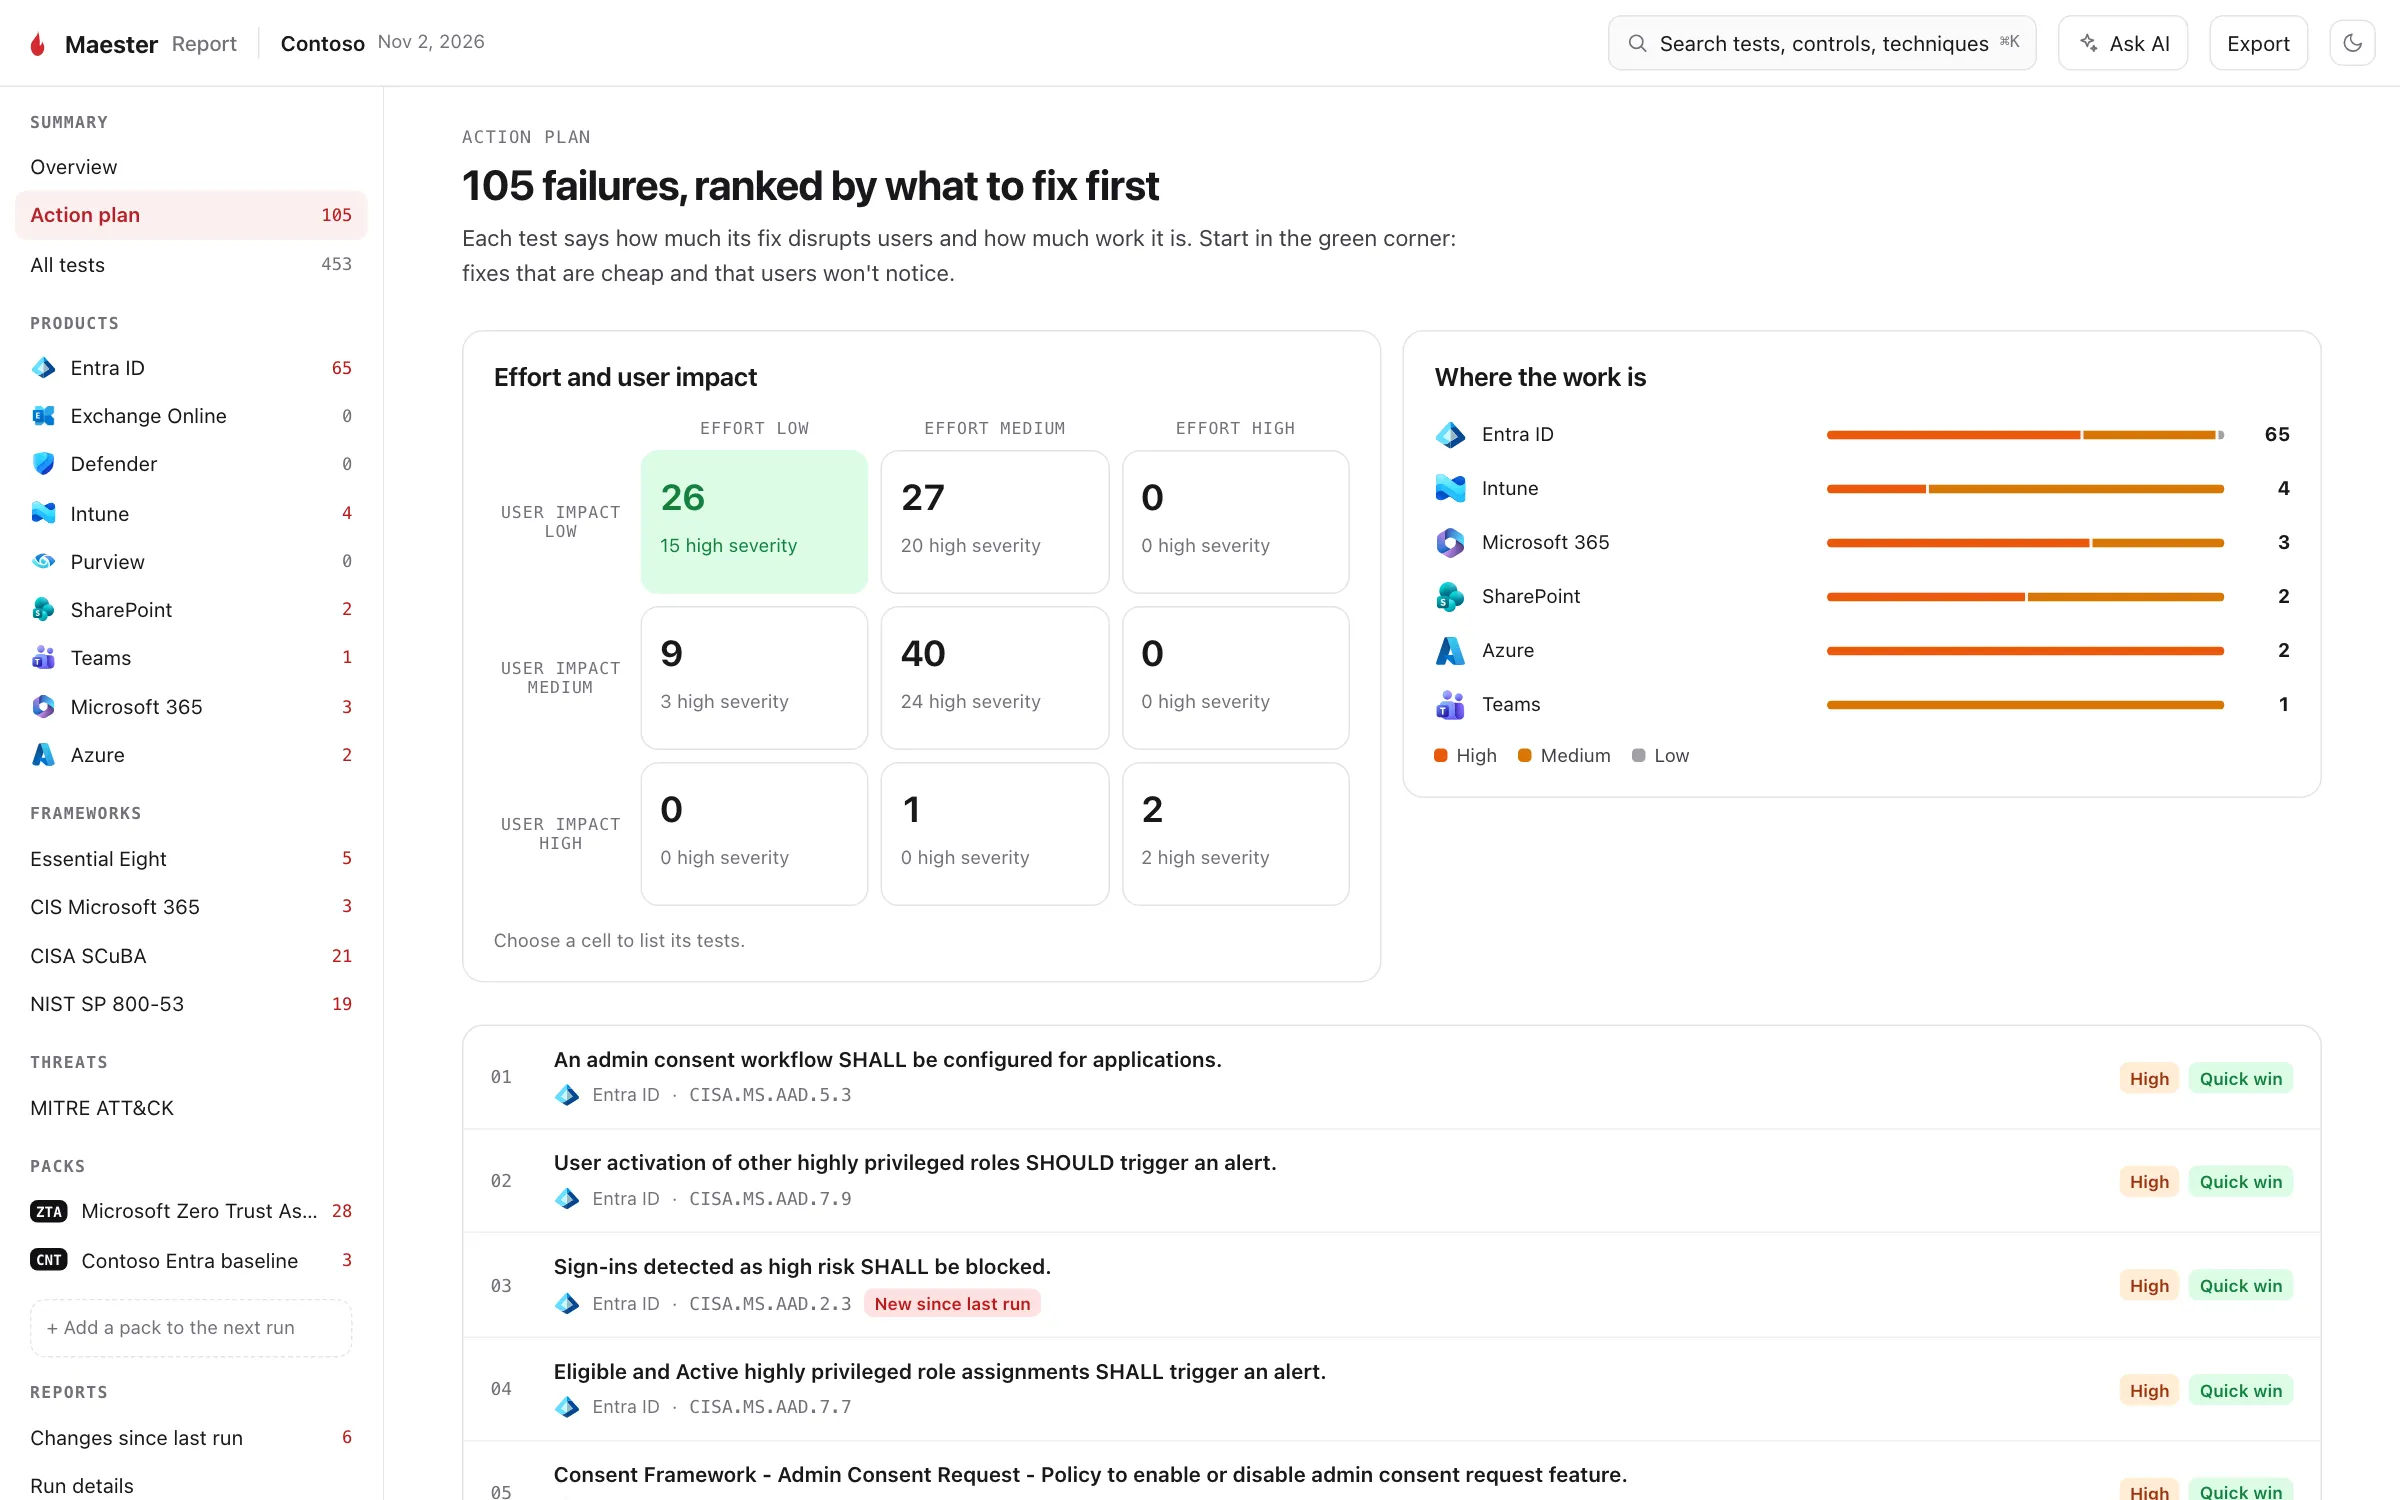
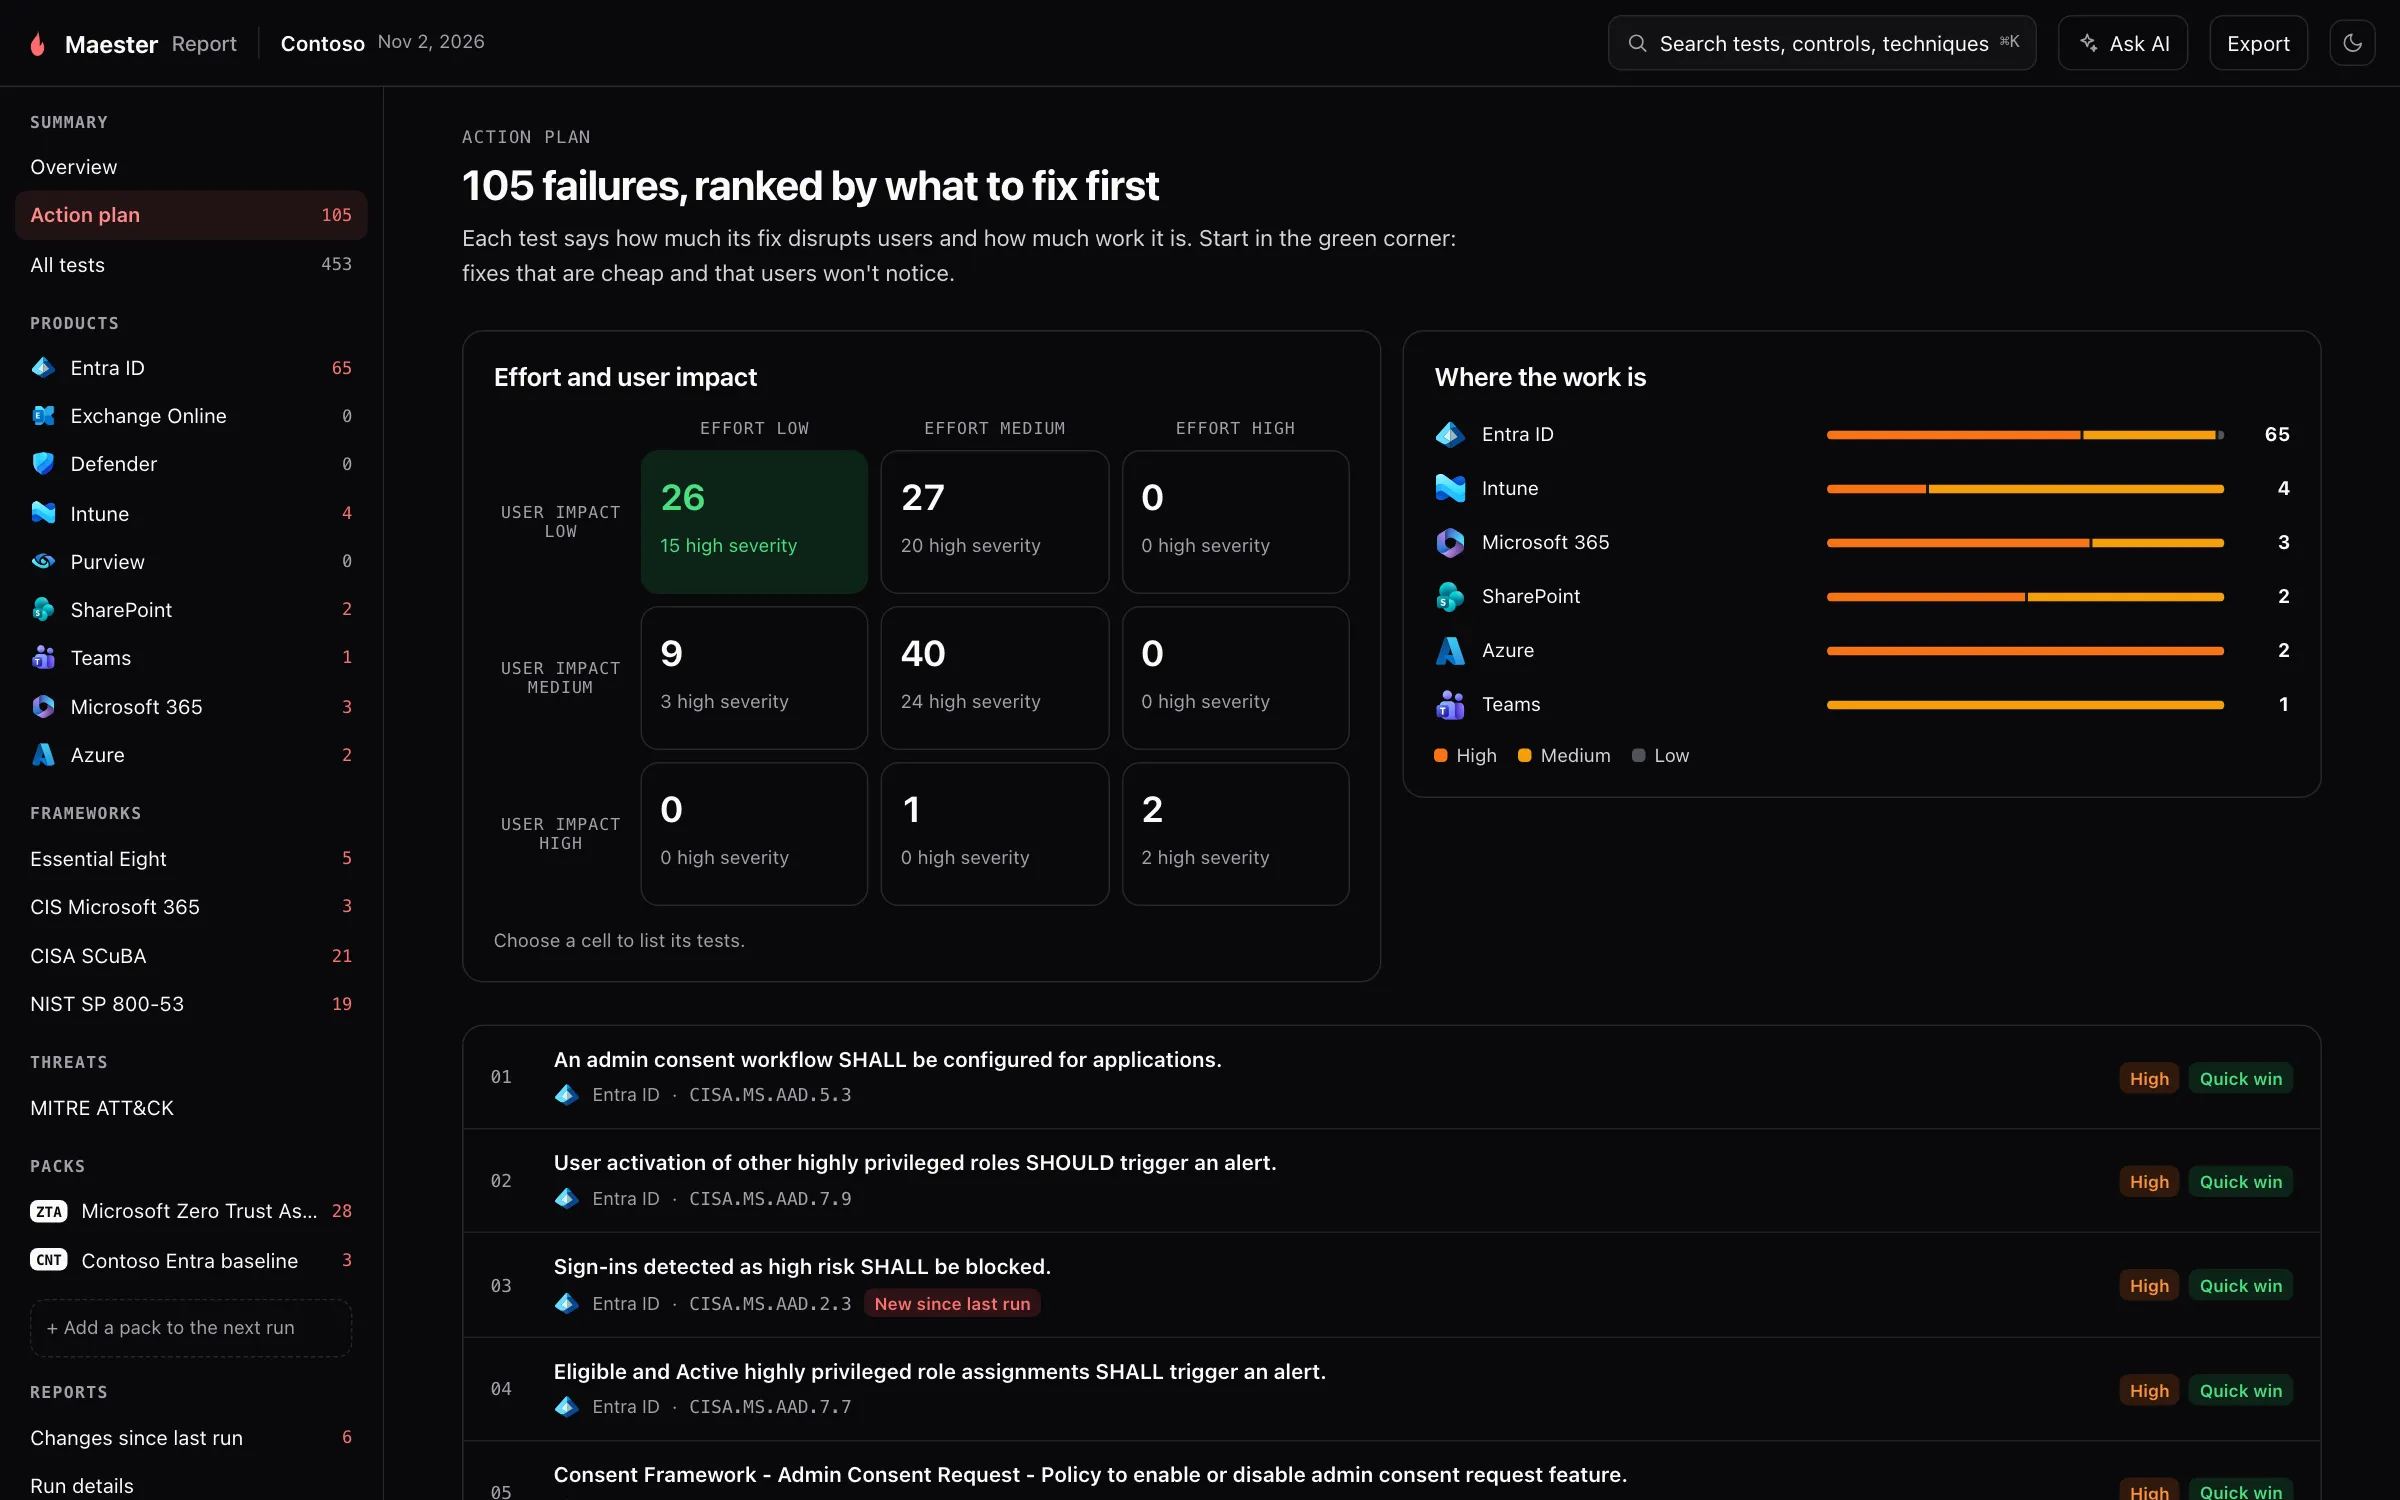
What it is for. Every failed test in one list, in the order to fix them.
Why we built it. Severity alone is a poor way to plan. Two high-severity findings can be very different jobs: one is a setting you change in a minute and nobody notices, the other changes how every user signs in. Each Maester test says how severe a failure is, how much the fix disrupts users, and how much work it is. The action plan uses all three.
How it helps.
- The grid sorts the failures by effort and user impact. Start in the green corner: fixes that are cheap and that users won’t notice. Select a cell to list its tests.
- Quick win marks those tests in every list in the report.
- Where the work is shows which product the failures are in, so you know which team to talk to.
- New since last run marks a failure that passed last time, which is often the one to look at first.
Changes since last run
Section titled “Changes since last run”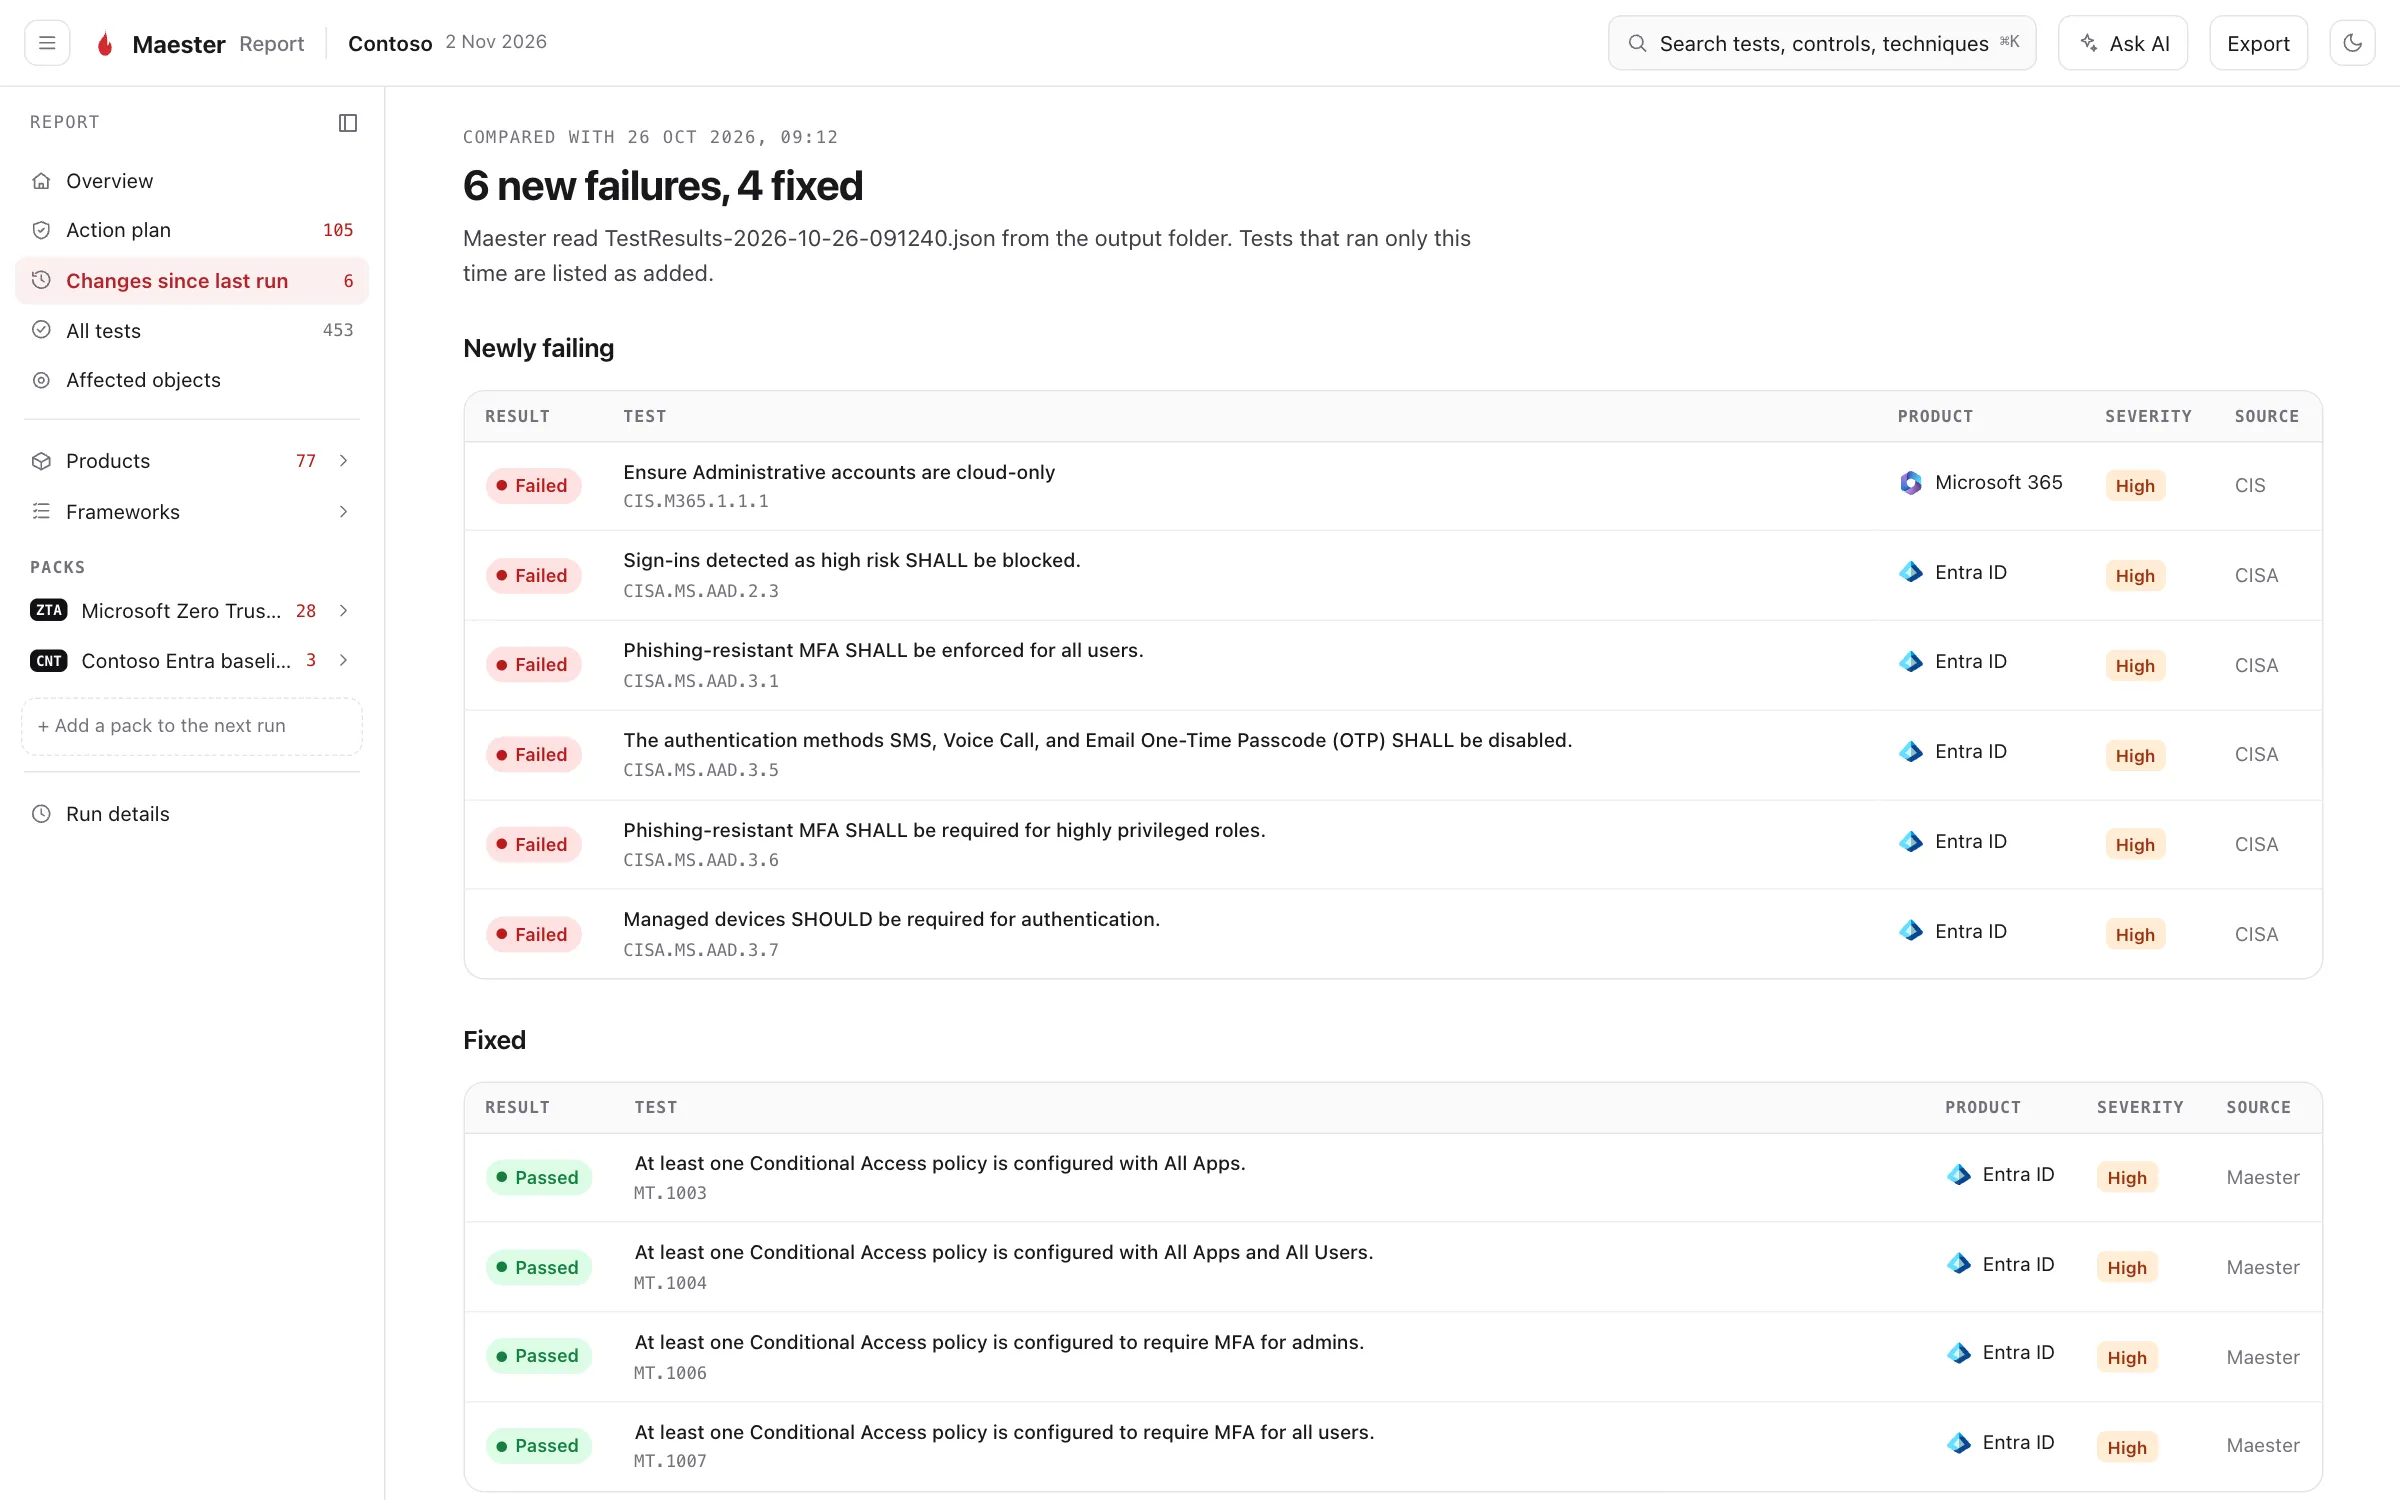
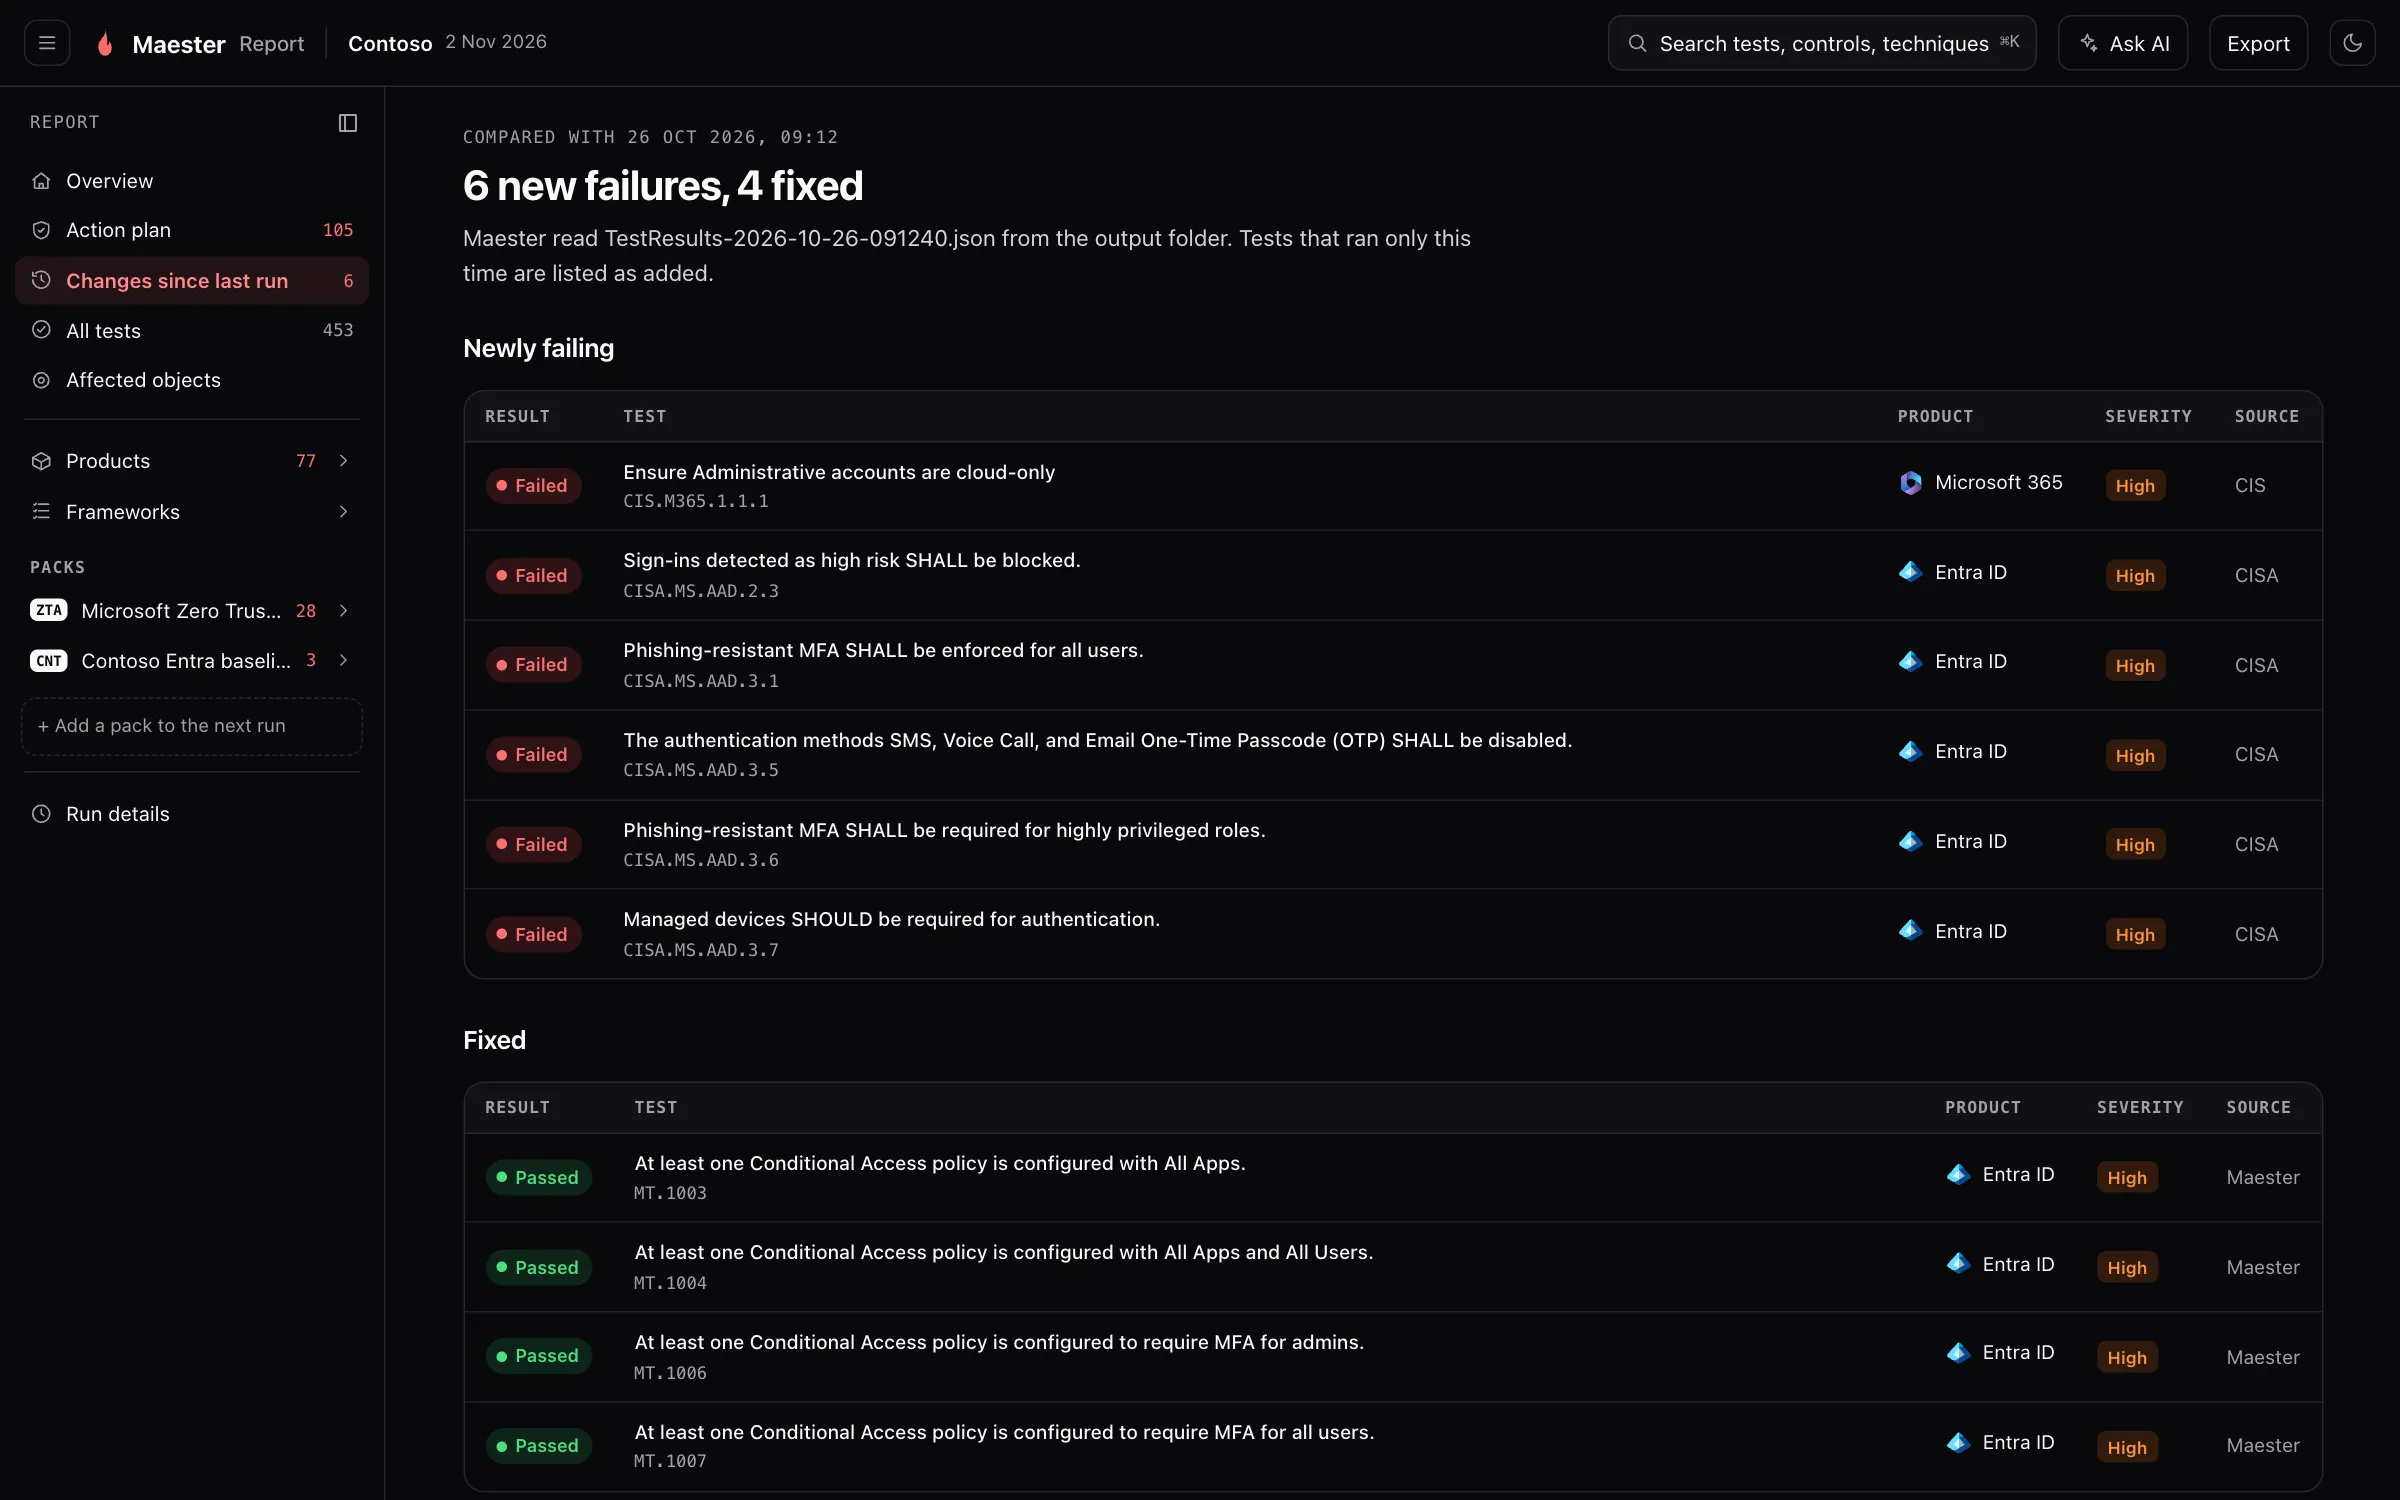
What it is for. The tests that started failing, and the ones you fixed, since the previous run.
Why we built it. When you run Maester every day, most of the report is the same as yesterday. What matters is the difference: a setting someone changed, or a fix that worked.
How it helps. Maester compares the run with the newest earlier results file in the output folder, so there is nothing to set up: keep writing to the same folder. Tests that ran only this time are listed as added, so a new test is not mistaken for a new problem. The page appears once there is an earlier run to compare with.
All tests
Section titled “All tests”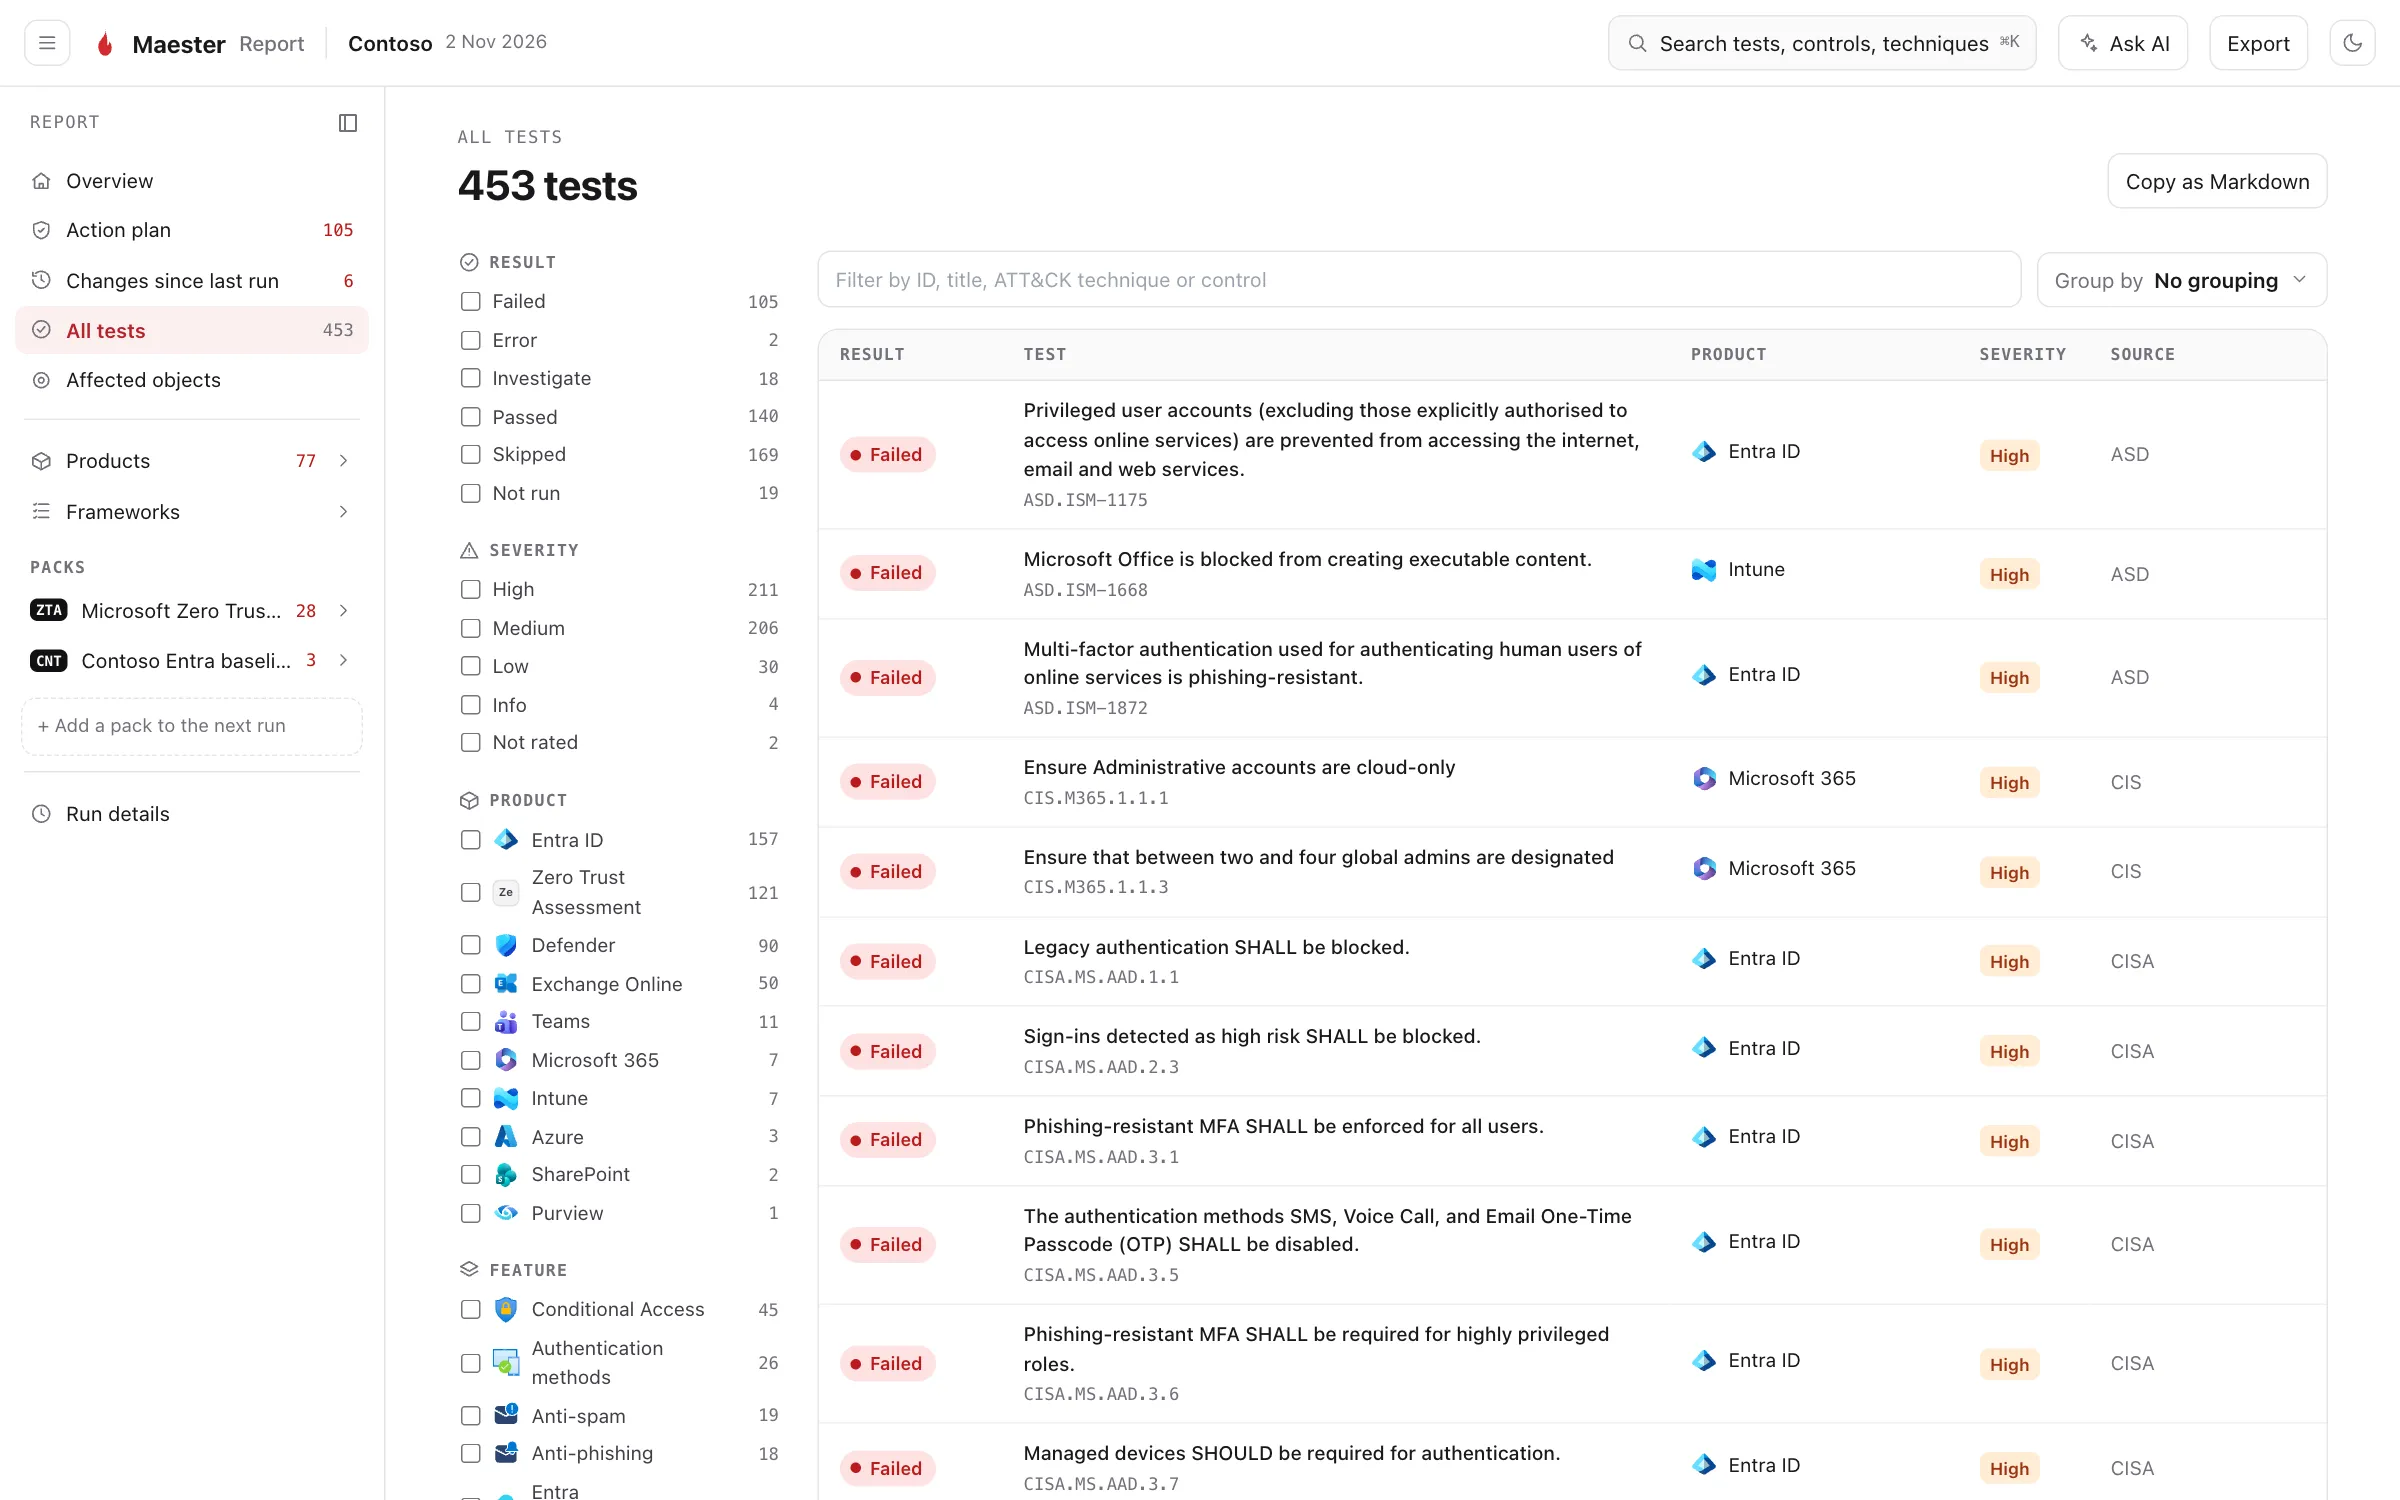
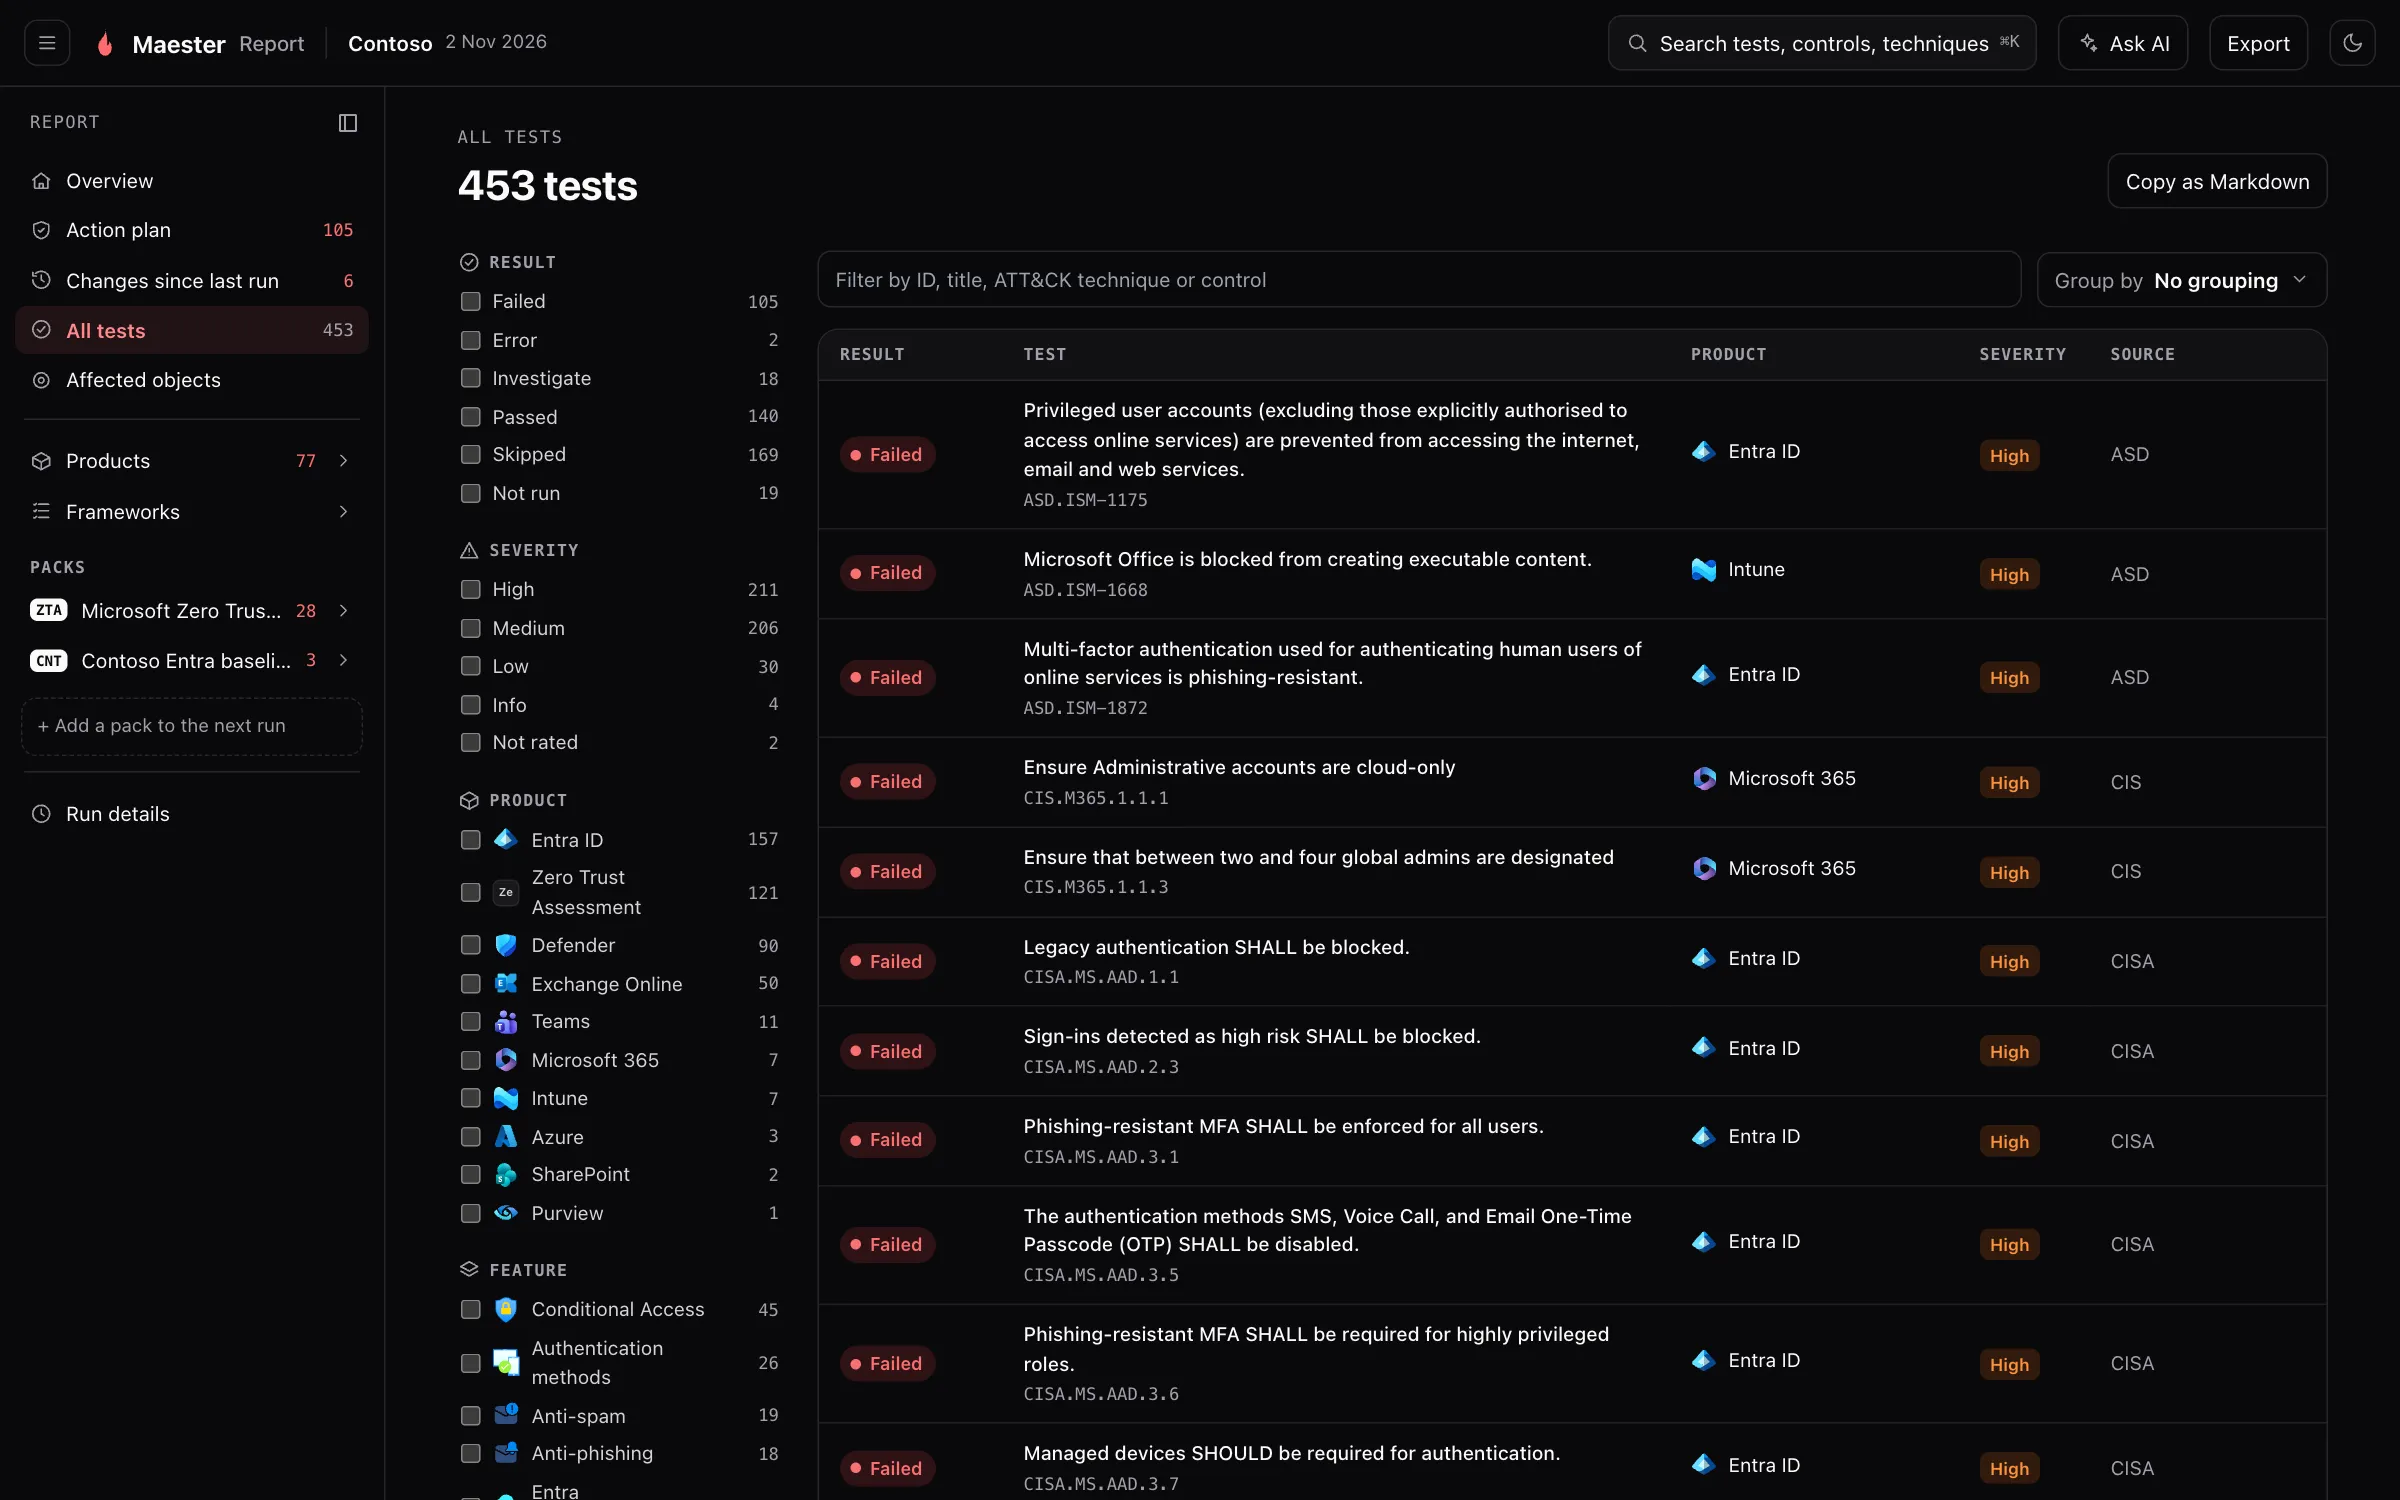
What it is for. The full list, for when you know what you are looking for.
Why we built it. The other pages are opinionated about what to show. This one leaves nothing out, and includes the tests that were skipped or did not run, with the reason.
How it helps. Filter by result, severity, product, feature, area or source, search by ID, title, ATT&CK technique or control, and group the list by any of them. Copy as Markdown copies what you have filtered, ready for a ticket.
A finding
Section titled “A finding”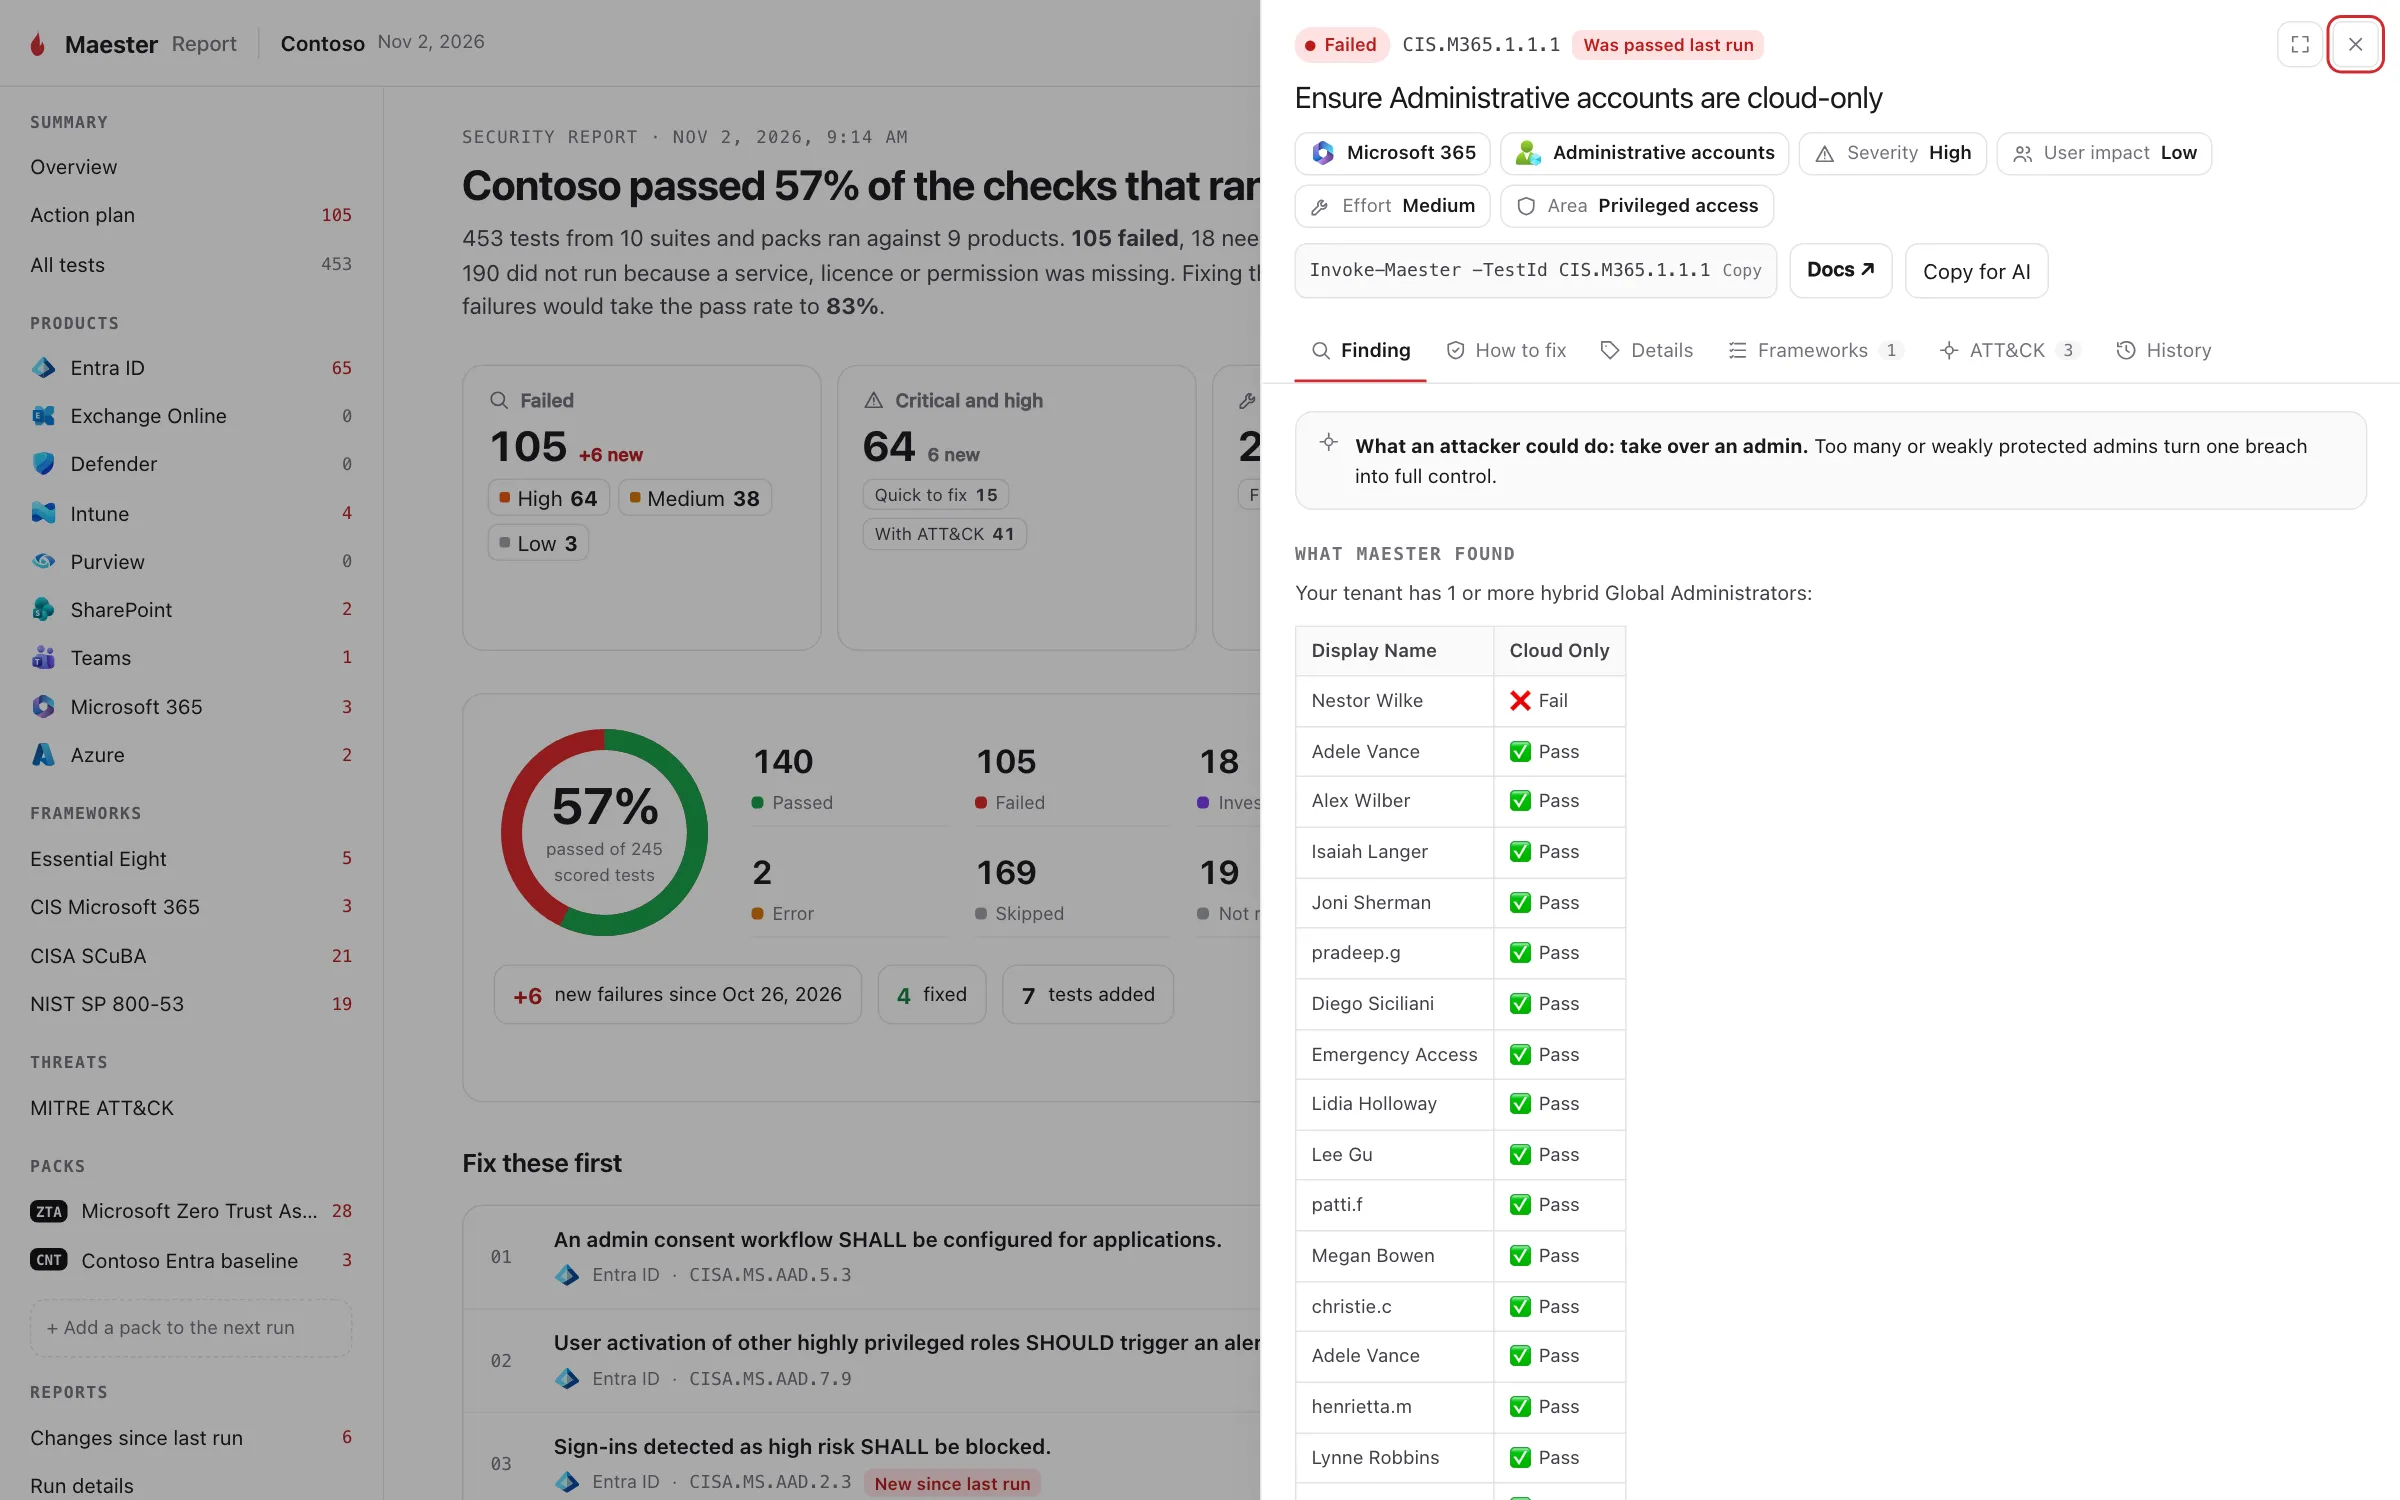
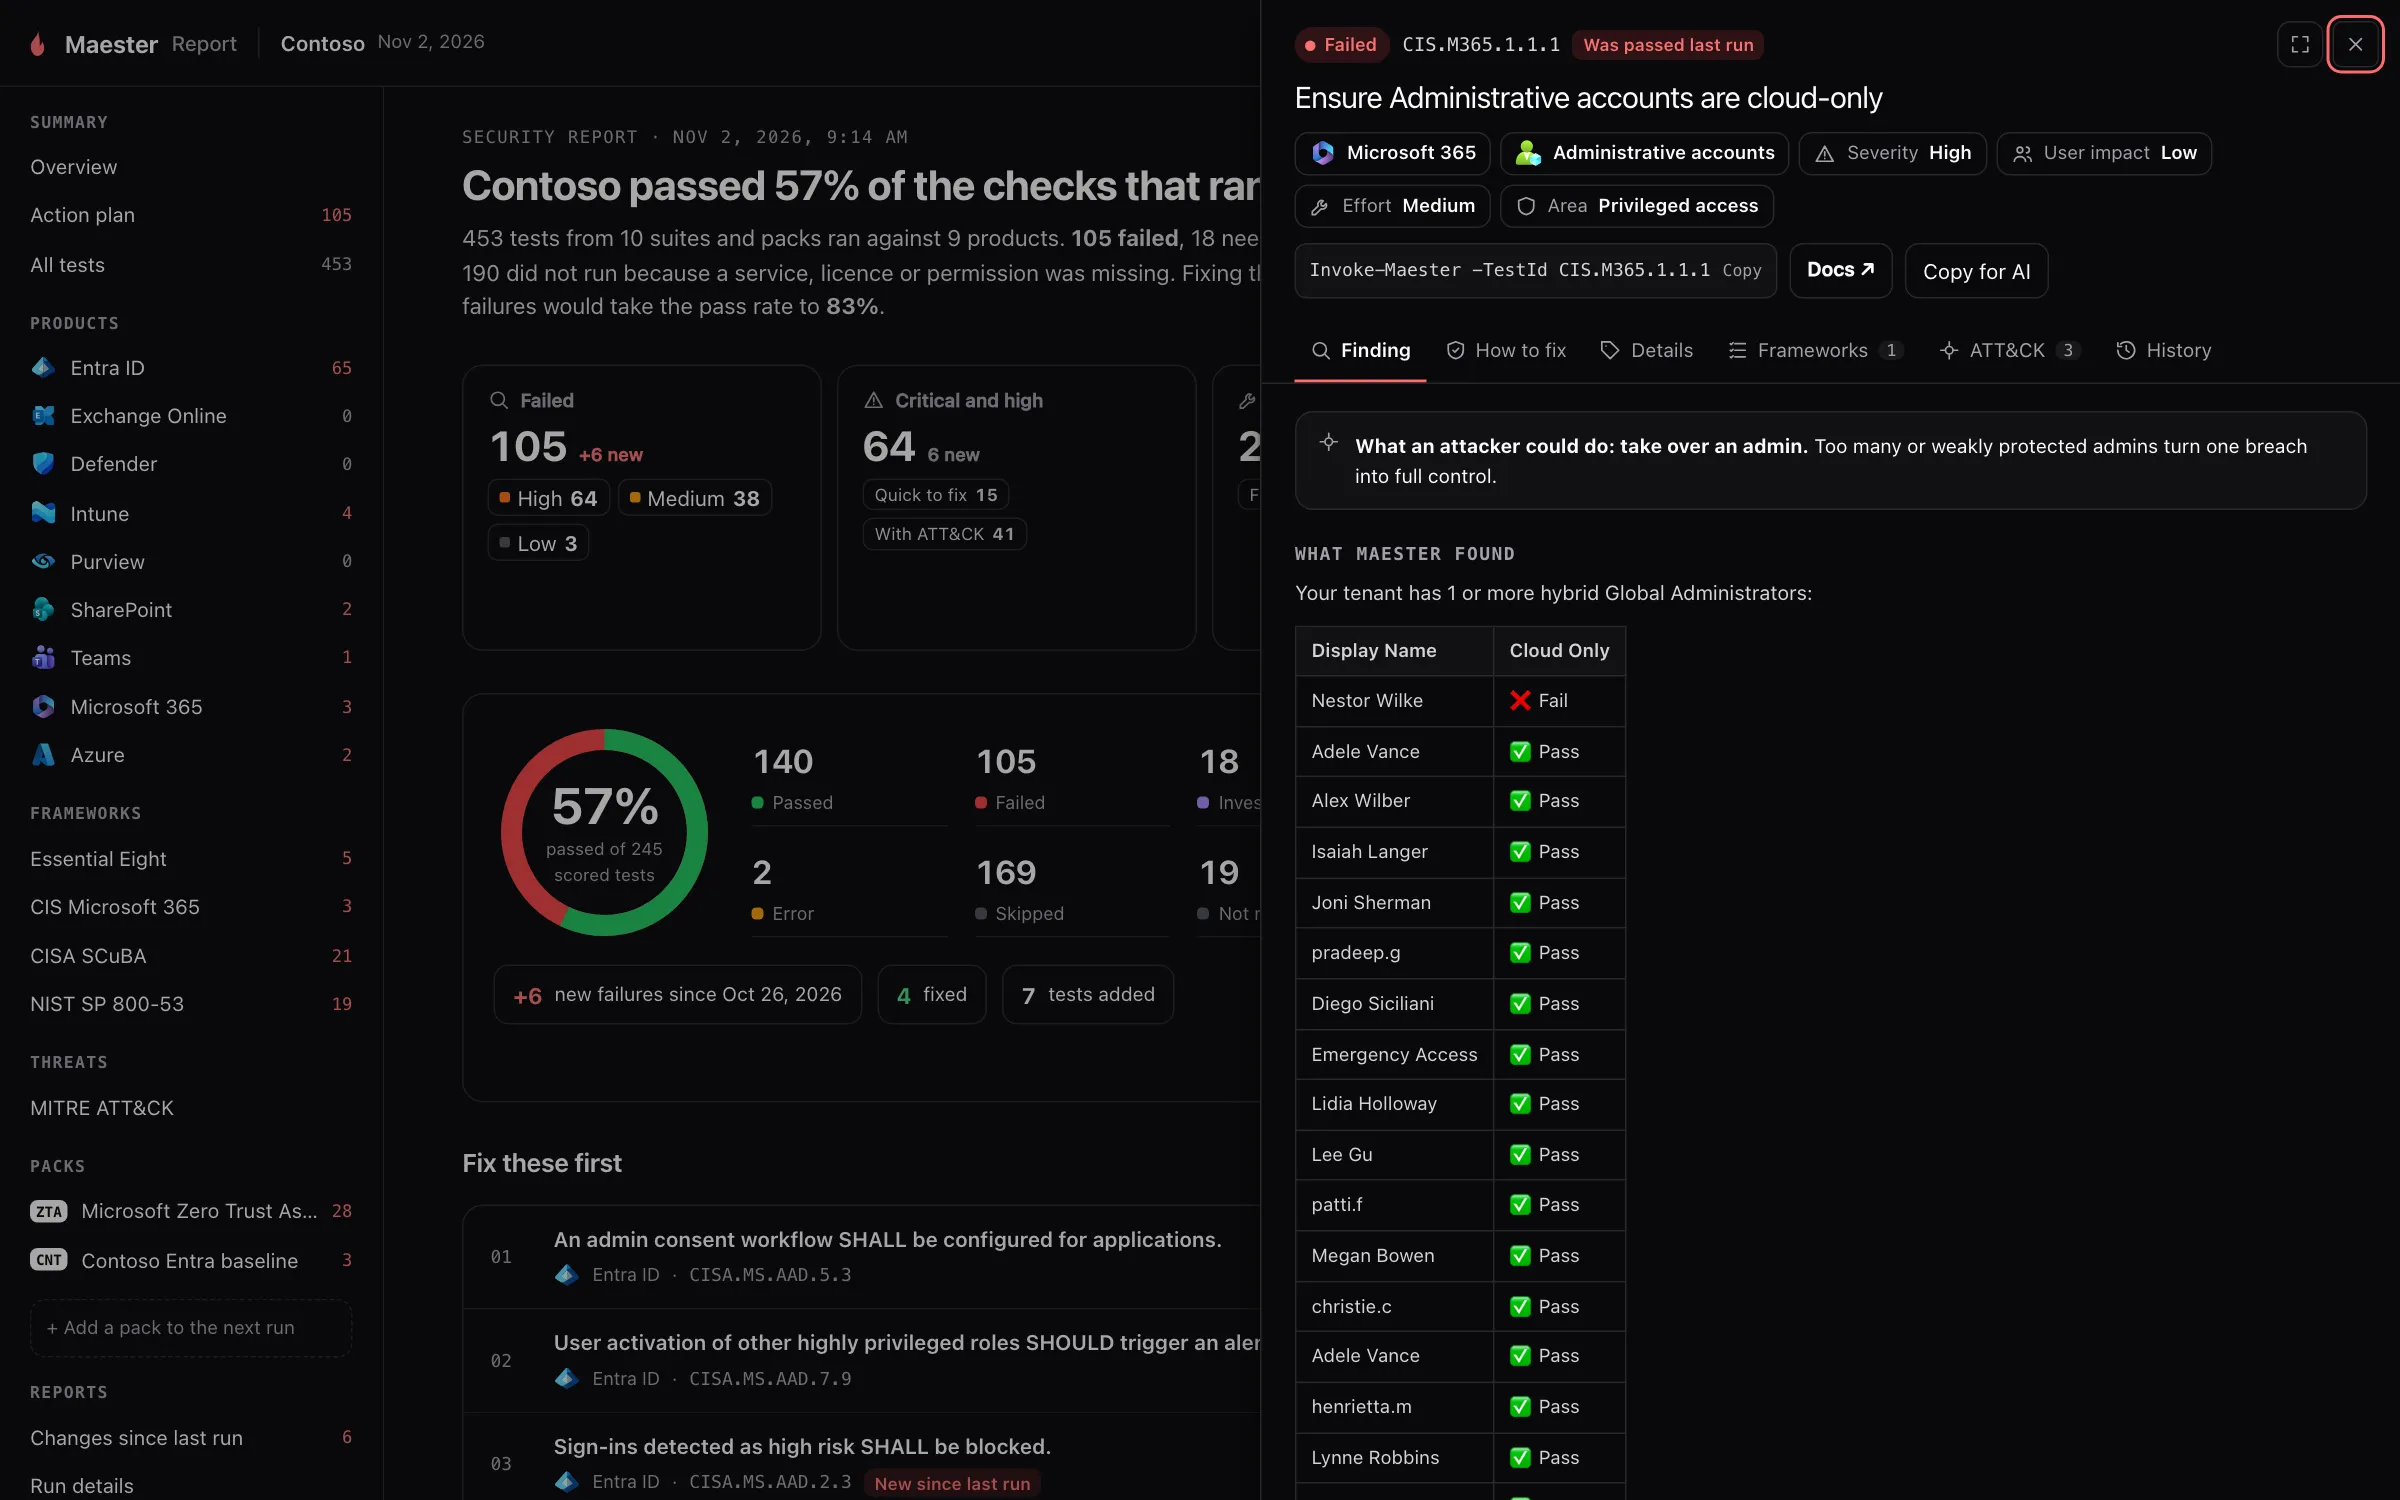
What it is for. Everything about one test, opened from any list in the report.
Why we built it. A result that says only “Failed” sends you to a search engine. The panel is meant to be enough to act on.
How it helps.
- Finding starts with what an attacker could do, then shows what Maester found: the users, policies or apps that caused the failure.
- How to fix gives the steps to remediate it.
- Details has the test’s severity, user impact, effort, product and area.
- Frameworks and ATT&CK list the requirements the test is evidence for and the techniques it helps defend against.
- History shows the result in earlier runs.
- The command at the top reruns just this test. Copy for AI copies the finding as text, and Docs opens the test’s page on maester.dev.
The panel opens over the page you were on, and the arrows step through the list you came from, so you can work through a set of failures without losing your place.
Affected objects
Section titled “Affected objects”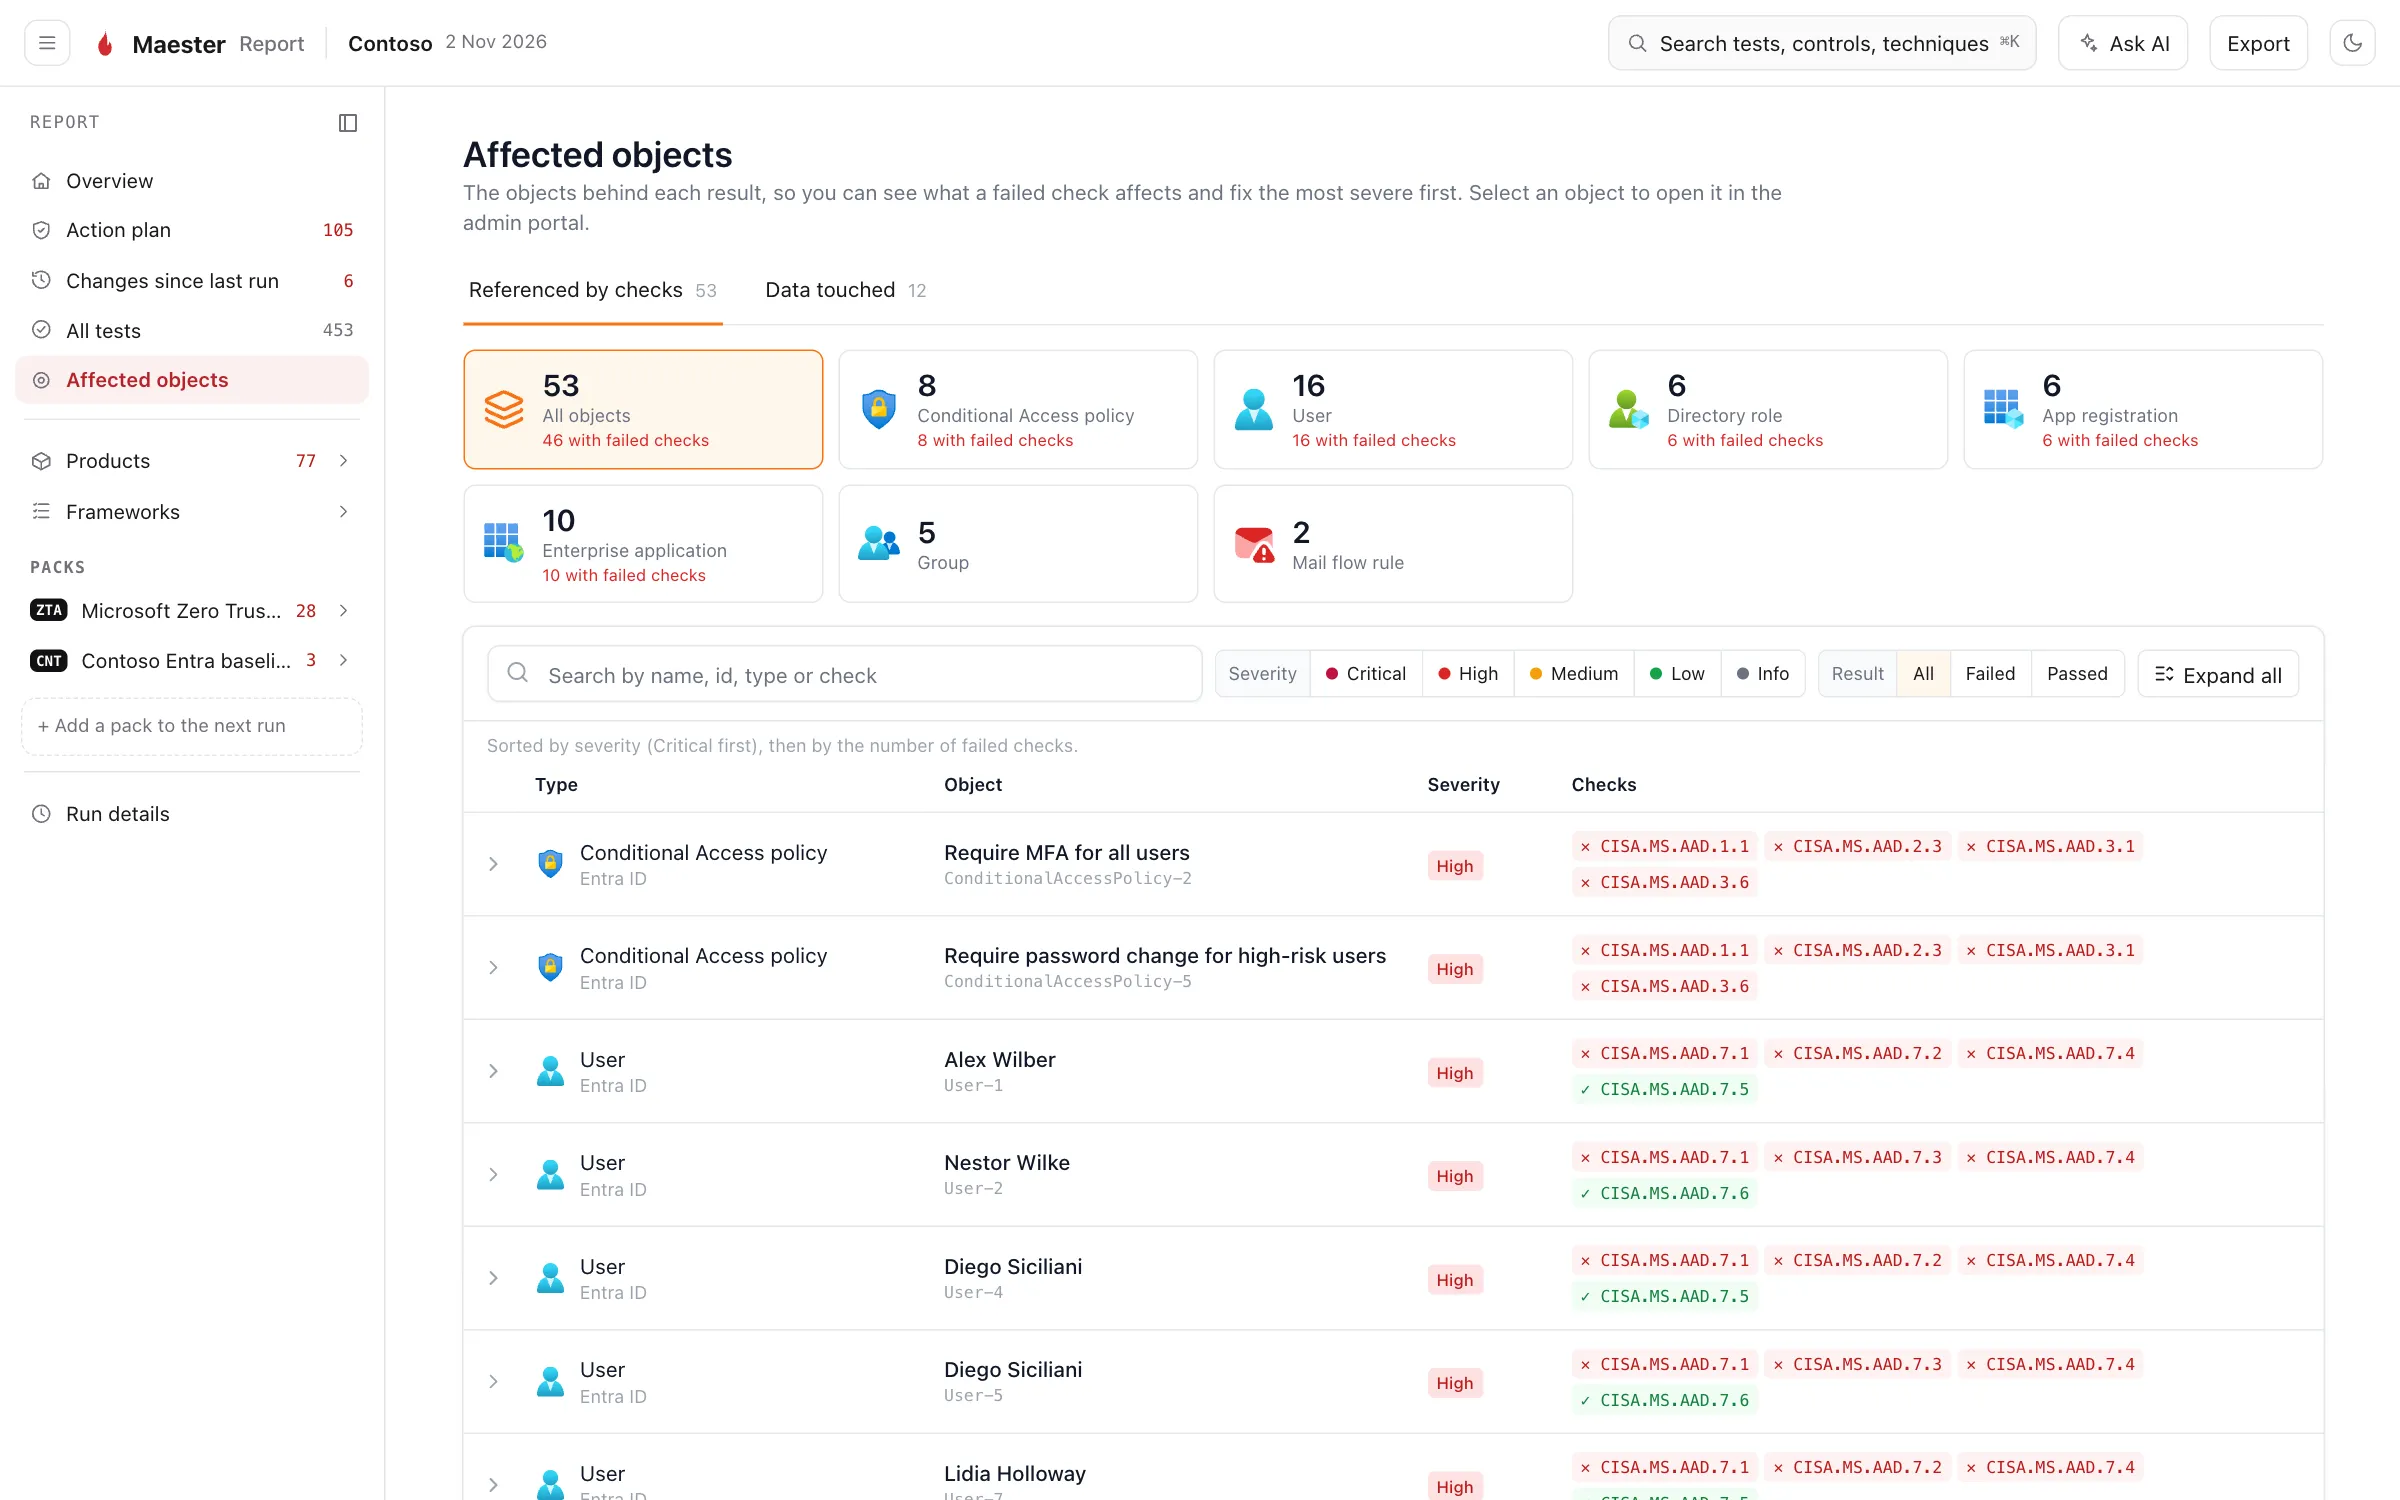
What it is for. The users, apps, policies, roles and devices behind the results, each with the tests it passed and failed.
Why we built it. Tests are how Maester thinks; objects are how you work. One risky app registration can fail five tests, and you fix it once.
How it helps. Objects are sorted by the severity and number of their failed checks, so the ones that need the most attention are at the top. Expand an object to see what is known about it, and select it to open it in the admin portal. See Exporting results for the files this page is built from, and for how to redact user identities before you share a report.
Products
Section titled “Products”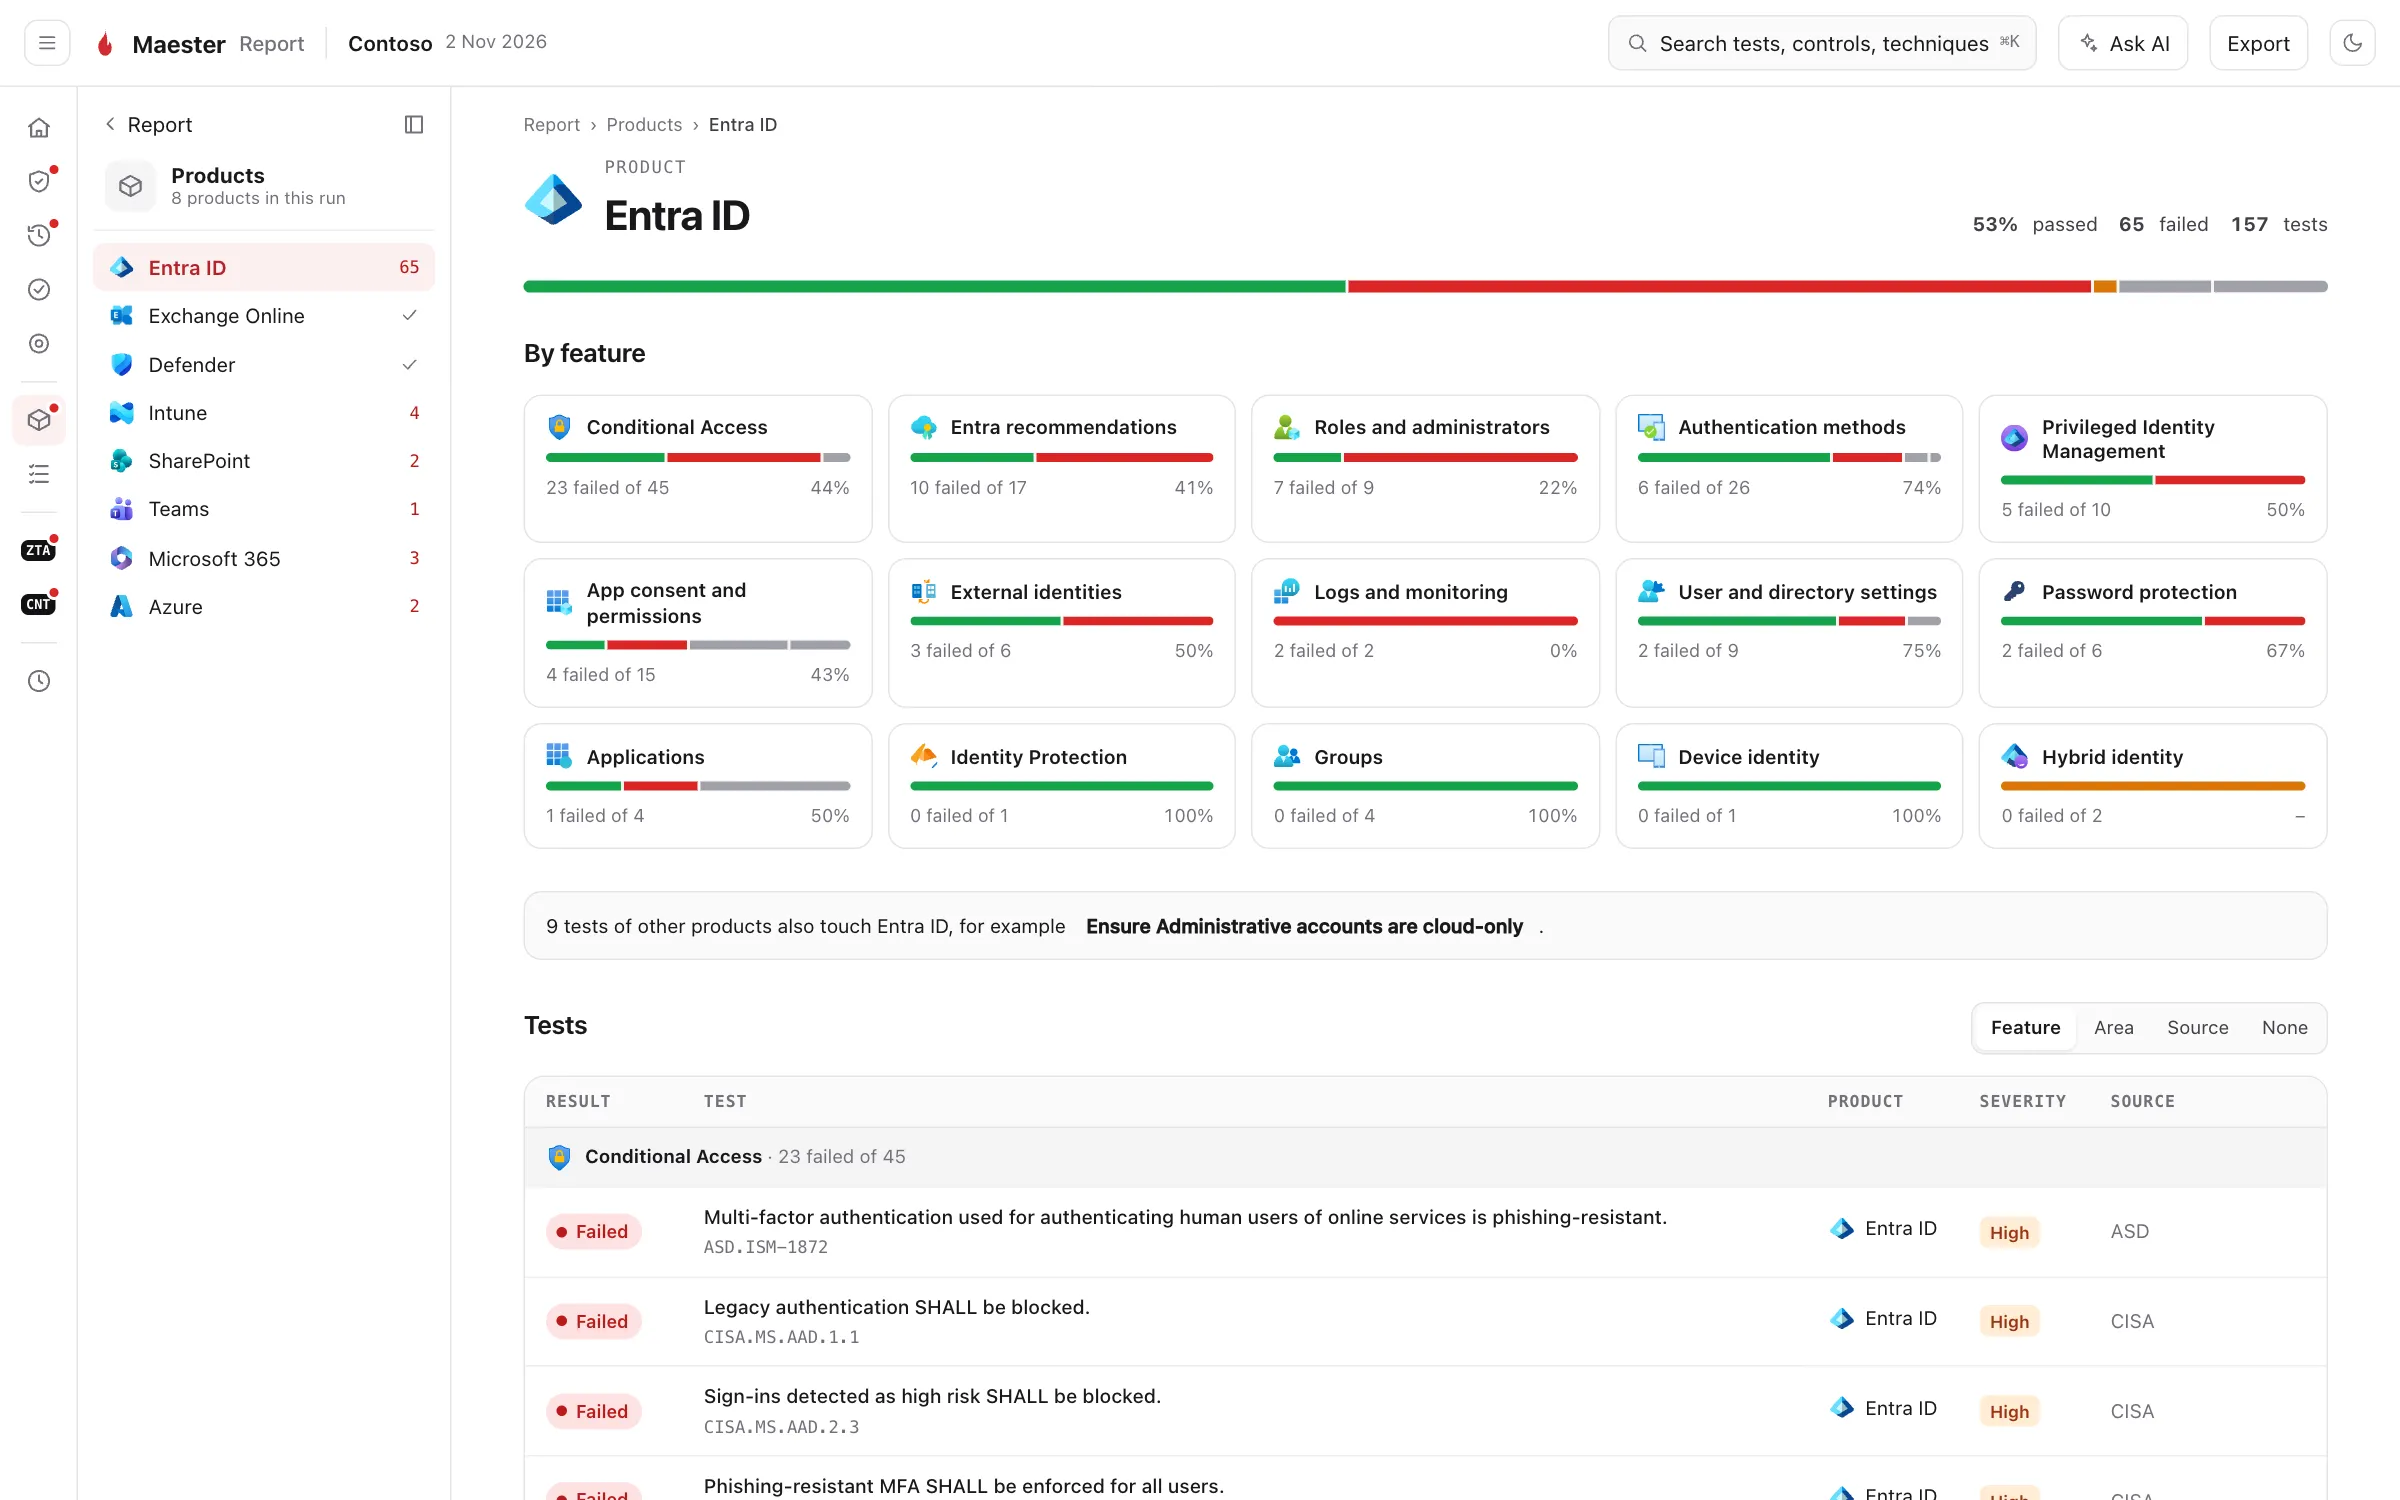
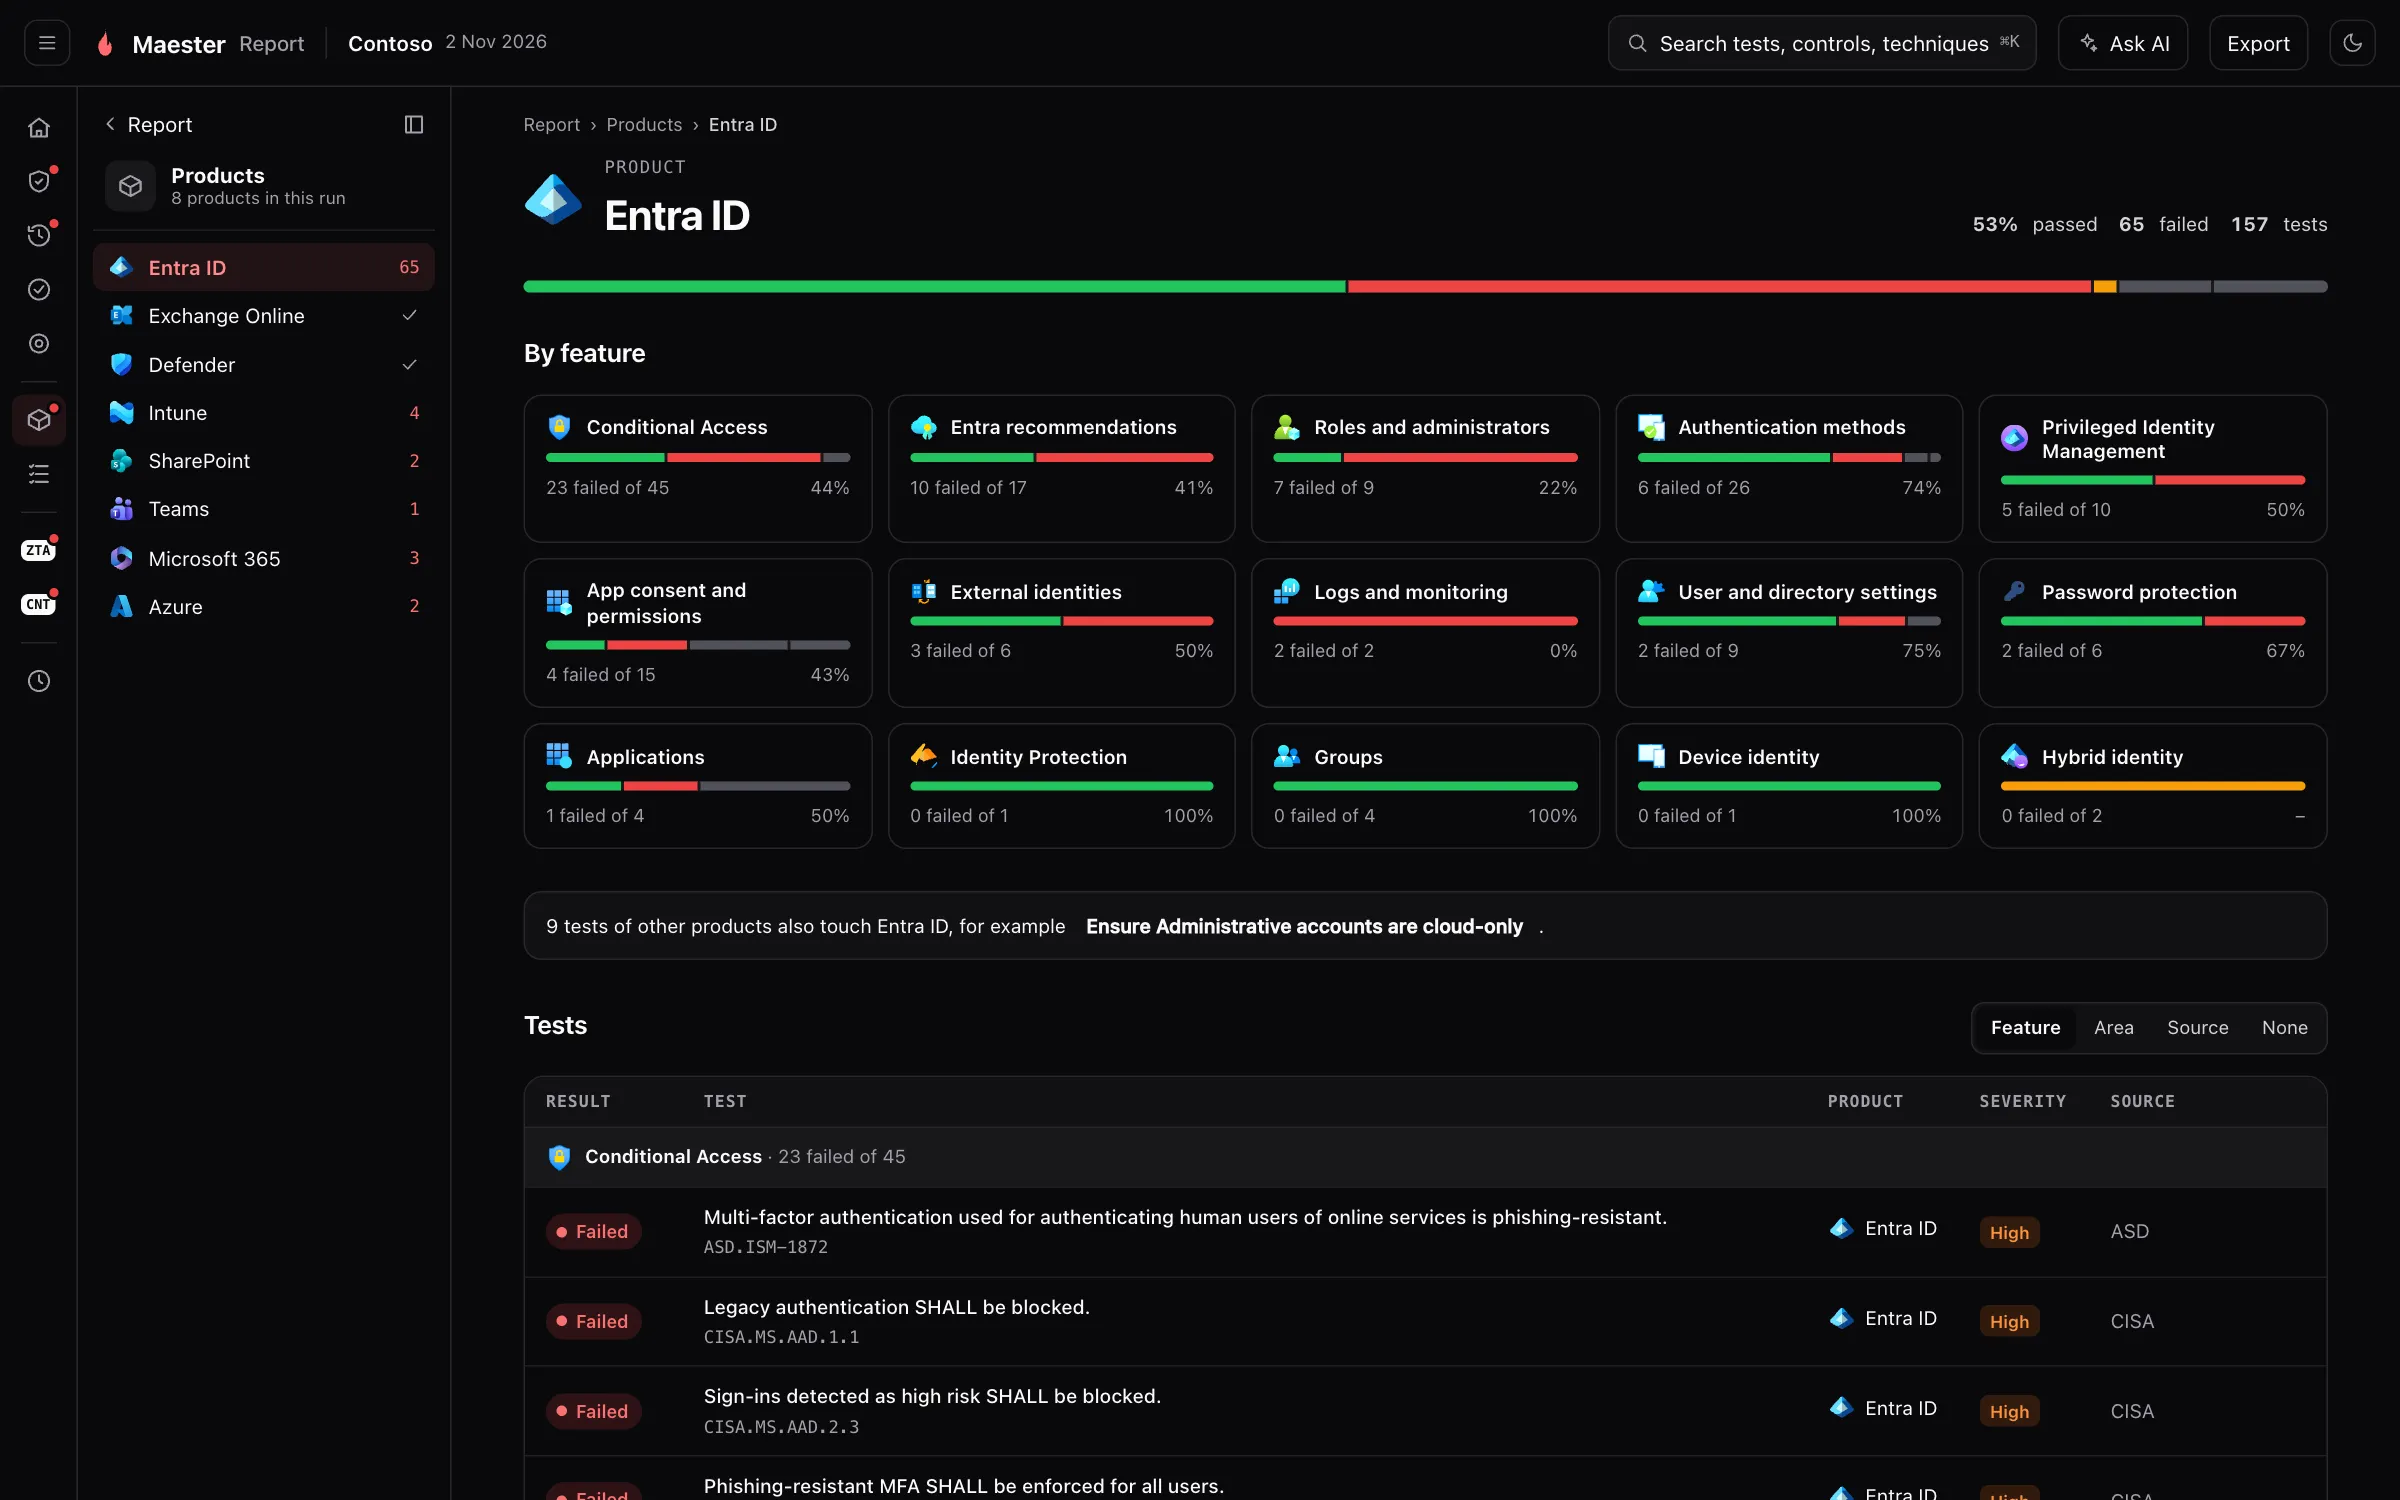
What it is for. One page for each product in the run: Entra ID, Exchange Online, Defender, Intune, Teams, SharePoint, Azure and the rest.
Why we built it. The people who fix findings usually own a product, not a tenant. The Exchange administrator wants the Exchange page and nothing else.
How it helps. Each product is split into its features, such as Conditional Access or Privileged Identity Management, with the pass rate of each. That shows where in the product the gaps are. The list below can be grouped by feature, security area or source. A product none of whose tests ran is left out of the menu.
Frameworks
Section titled “Frameworks”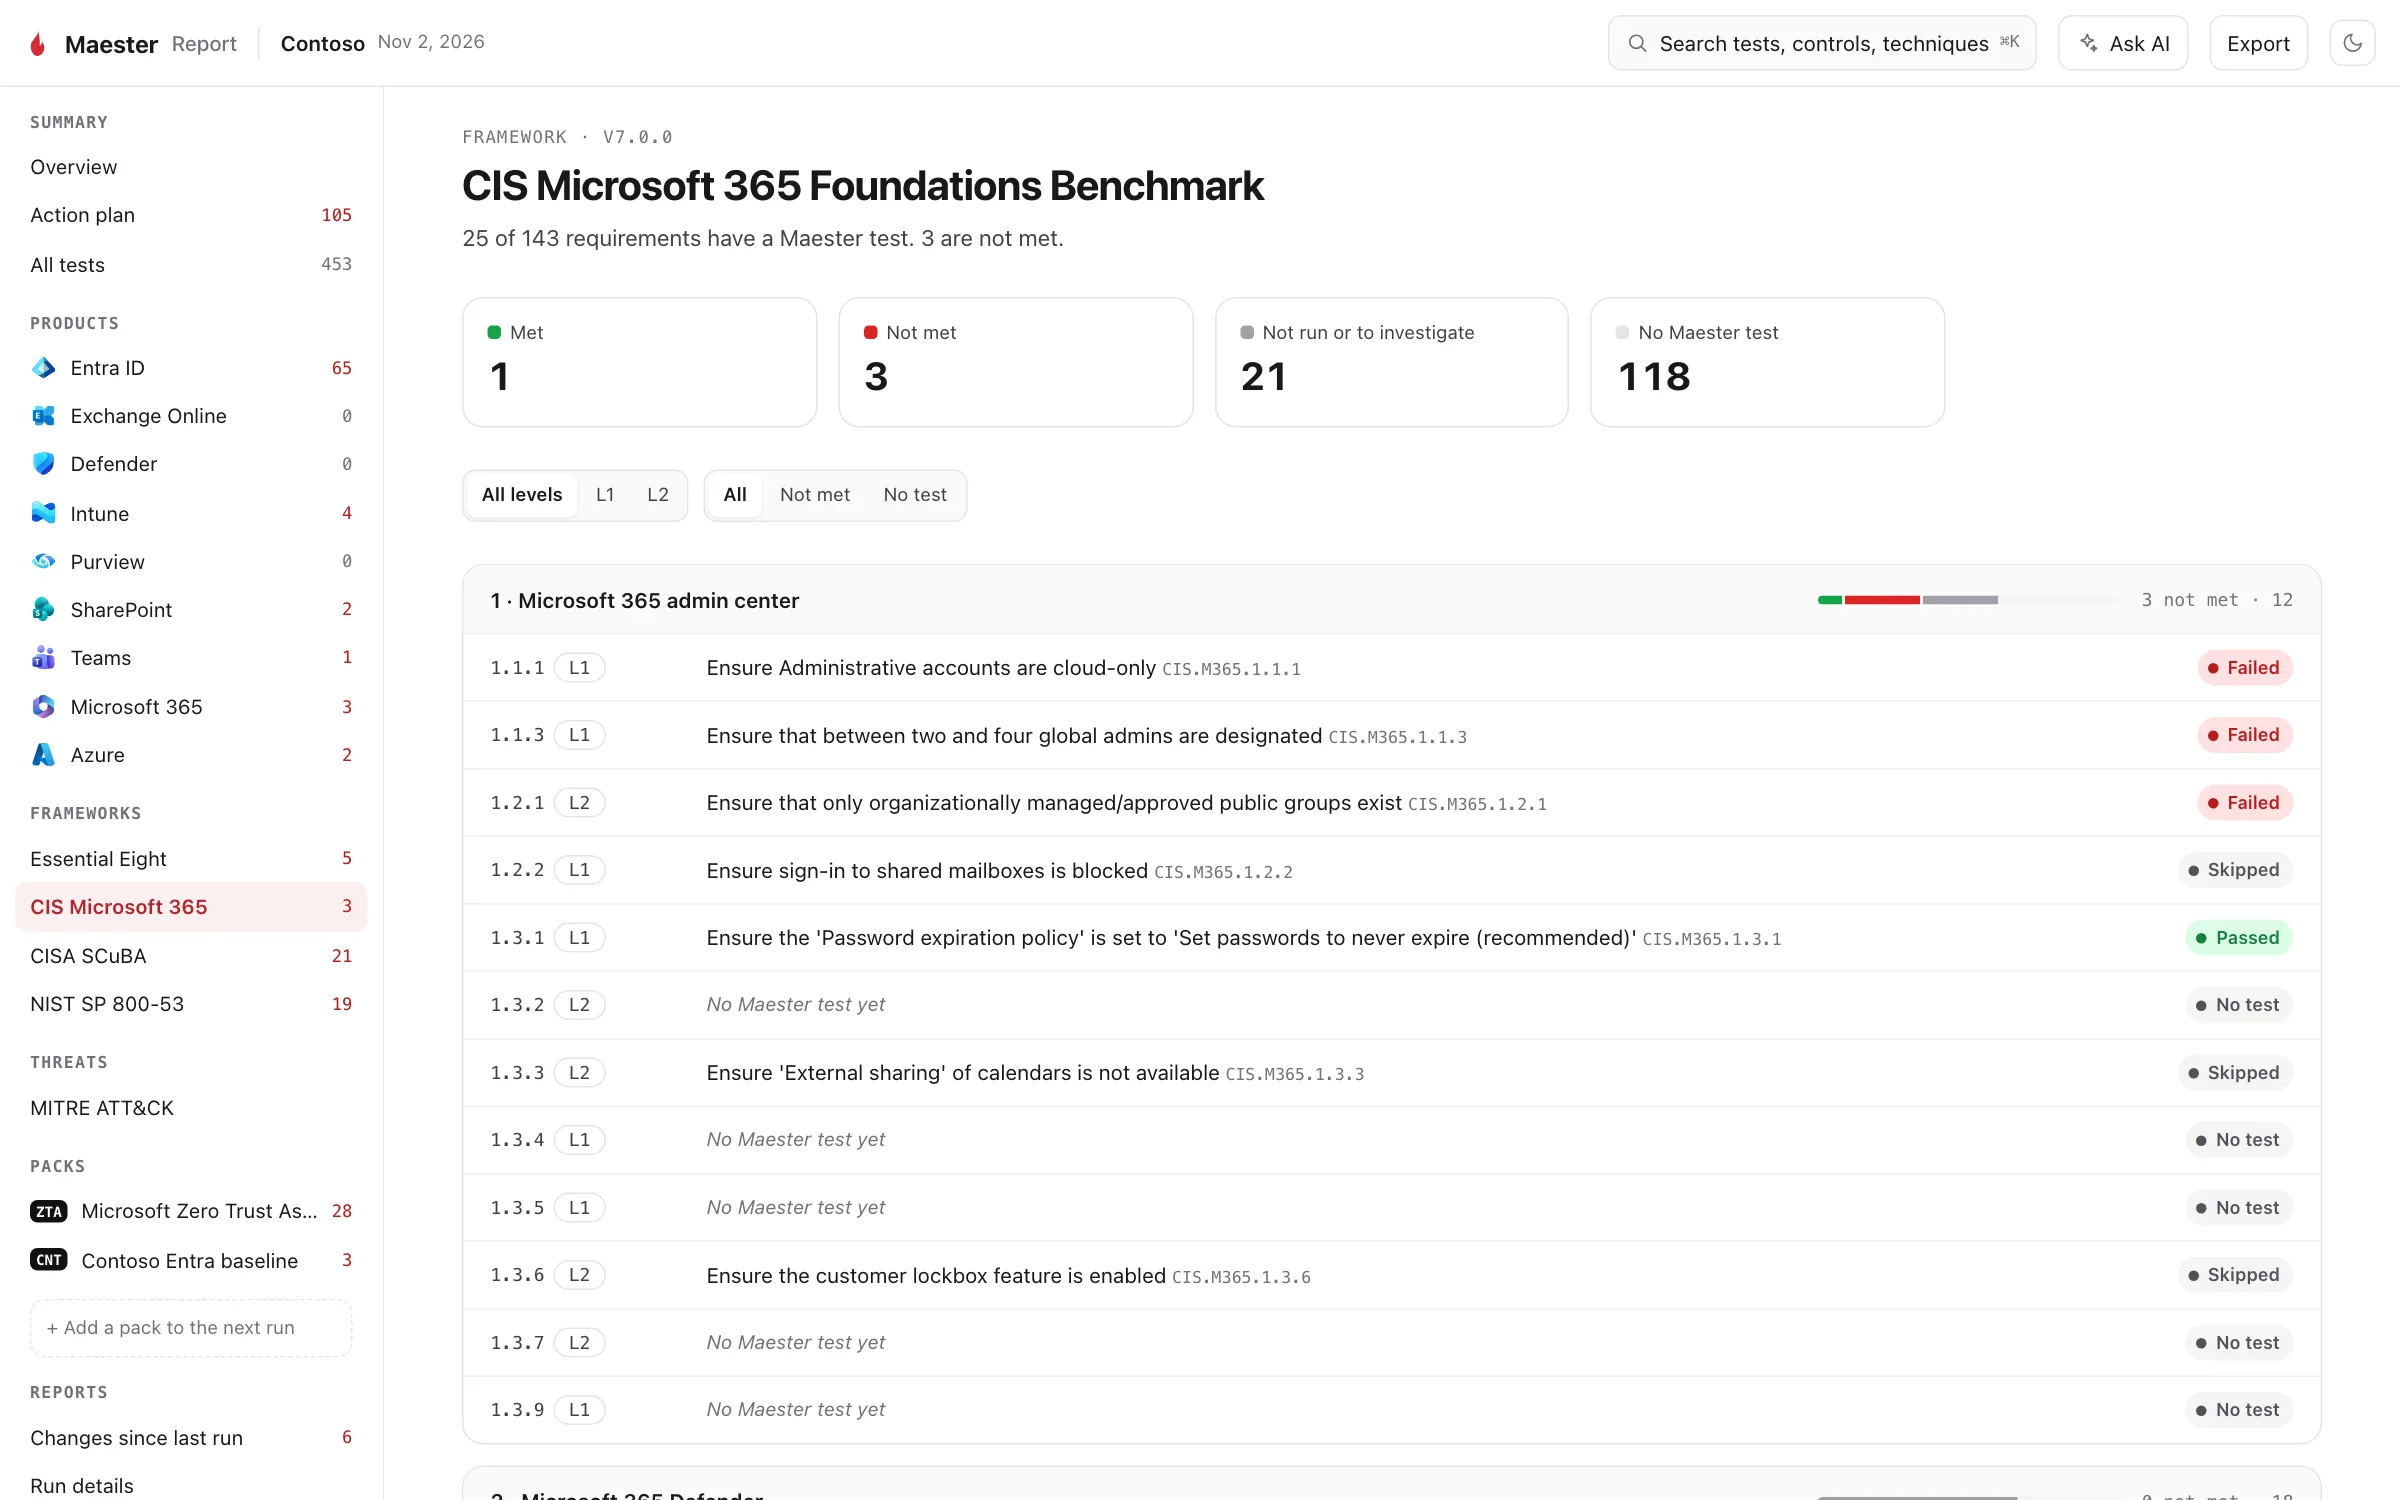
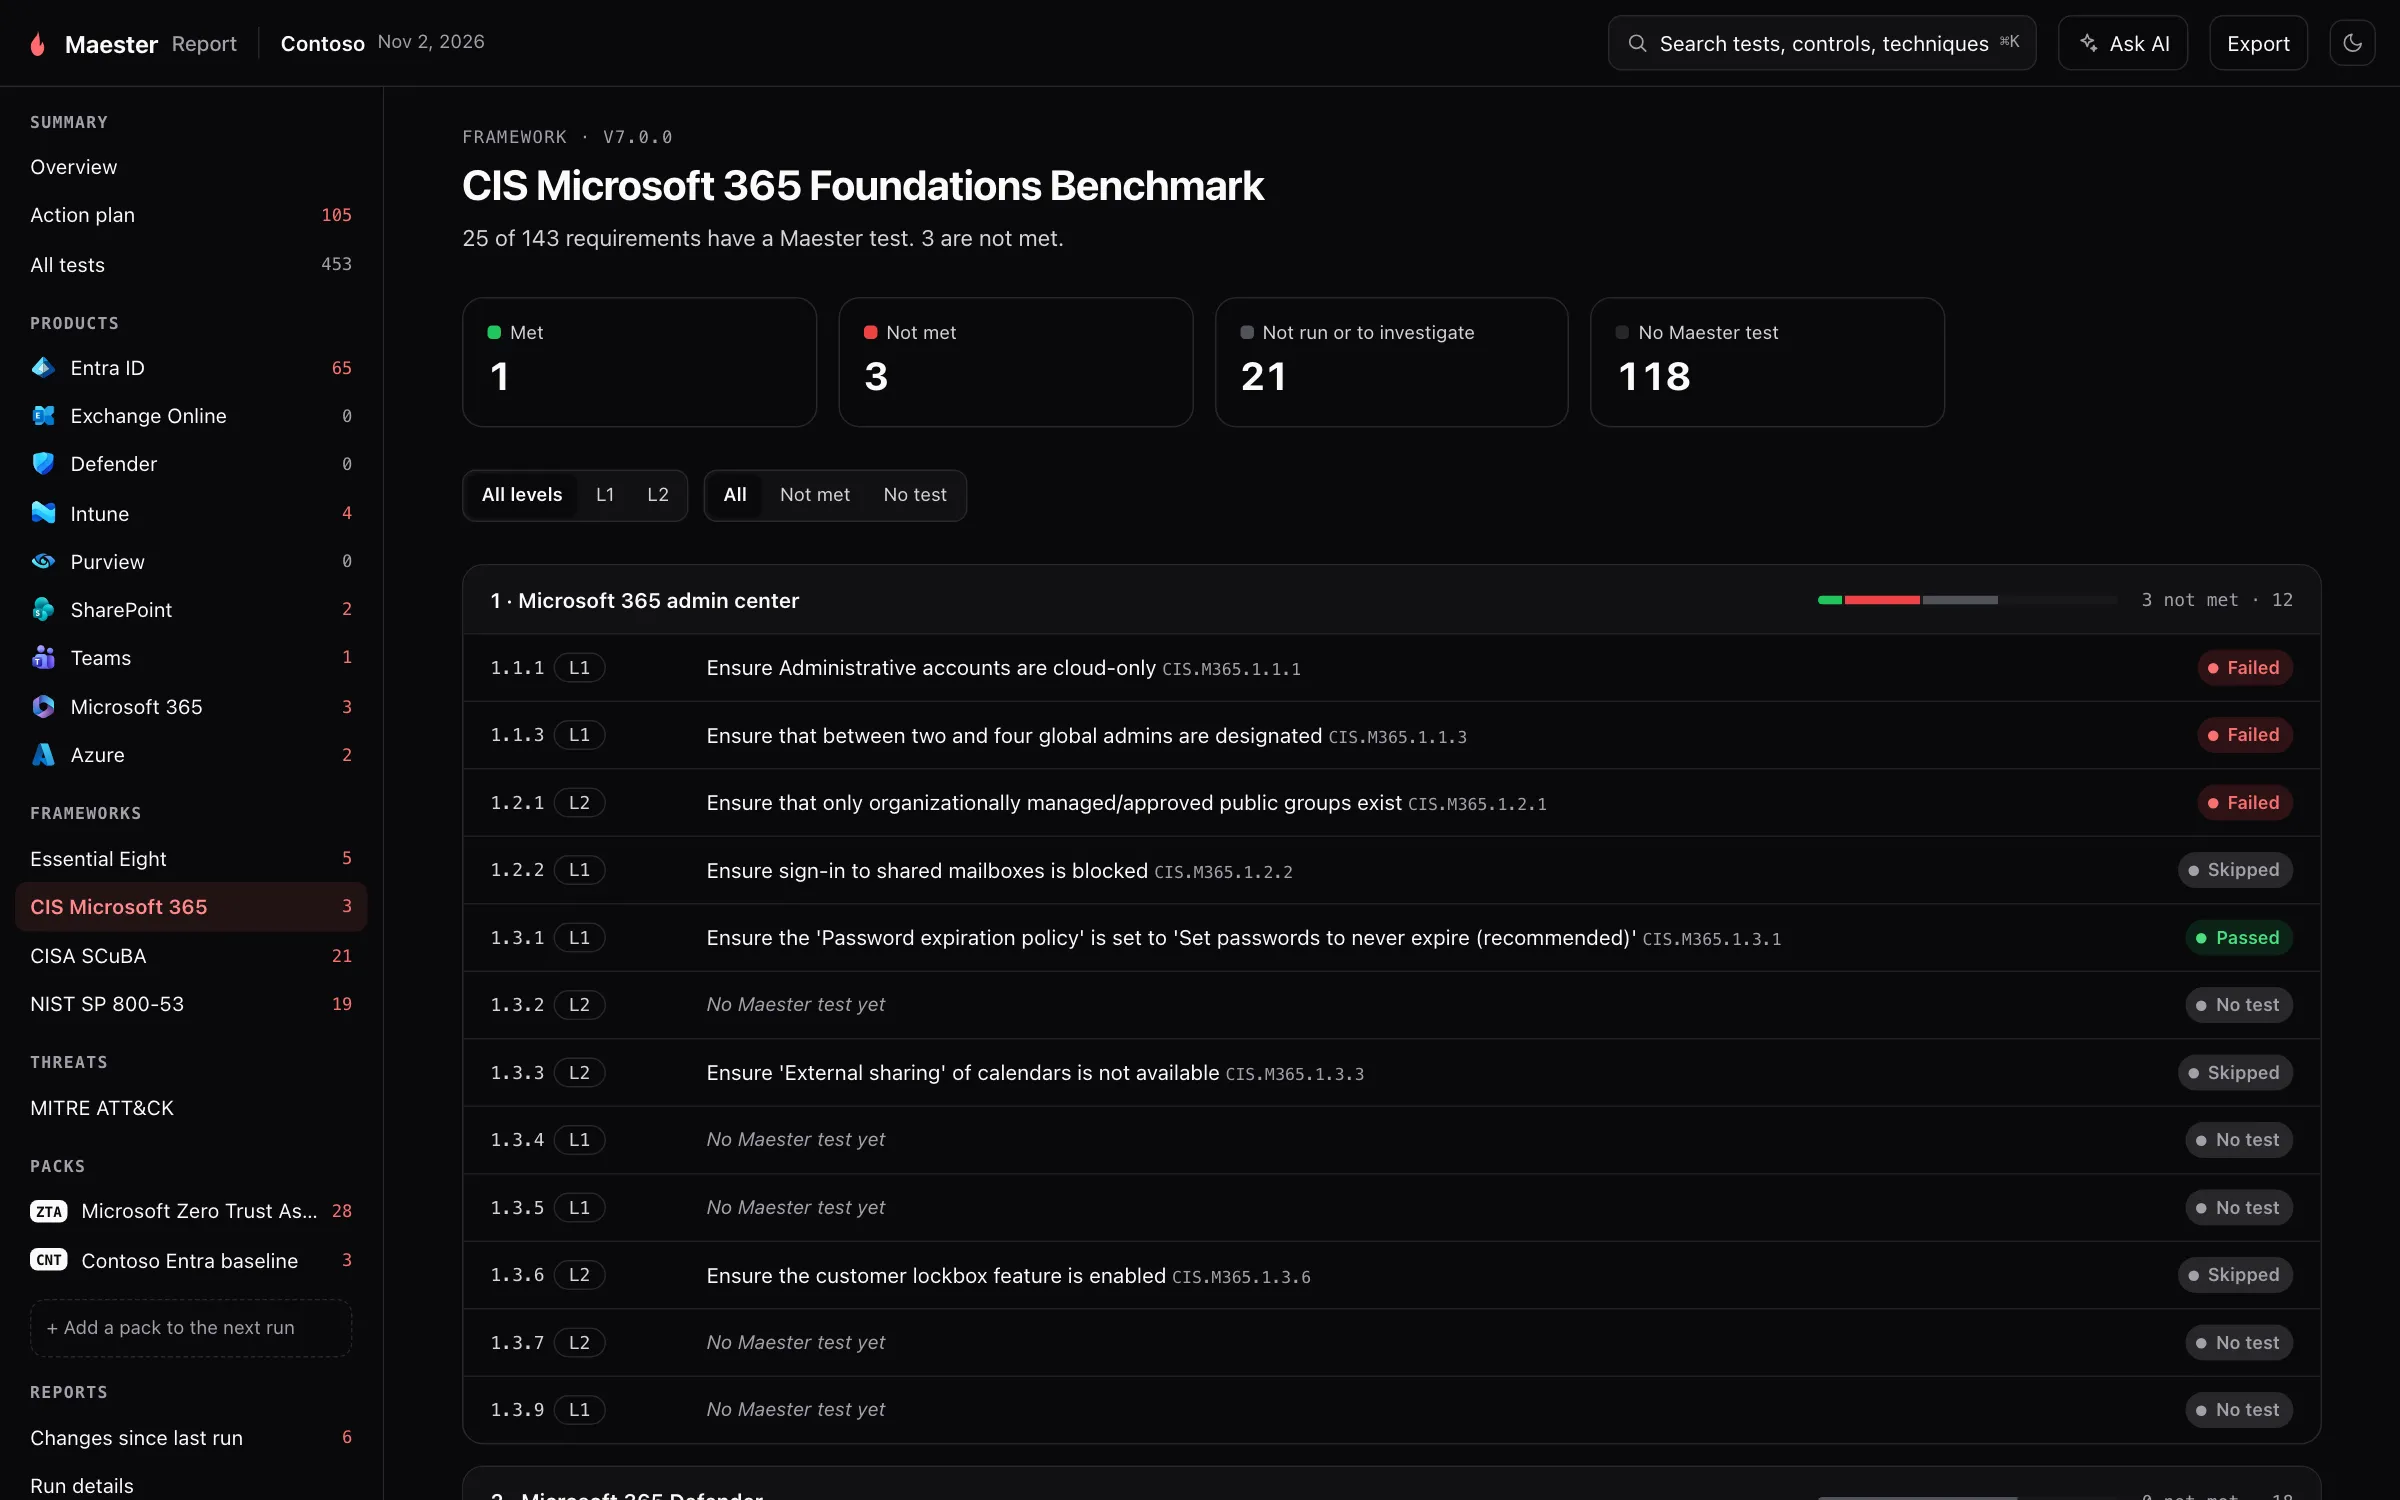
What it is for. How the run maps to a benchmark, such as CIS, CISA SCuBA, the ASD Essential Eight, DISA STIGs and NIST SP 800-53. Each framework the run has tests for gets a page.
Why we built it. Auditors and customers ask about a framework, not about test IDs. Answering used to mean a spreadsheet kept by hand.
How it helps.
- Each requirement of the benchmark is a row, with its level and the result of the test that checks it.
- A requirement with no Maester test yet is shown as such. The page never counts something as met because nothing checked it, so you can see what you still need to check yourself.
- A test can be evidence for several frameworks at once, so fixing one finding can move more than one of them.
See Choosing a baseline for what each framework covers.
MITRE ATT&CK
Section titled “MITRE ATT&CK”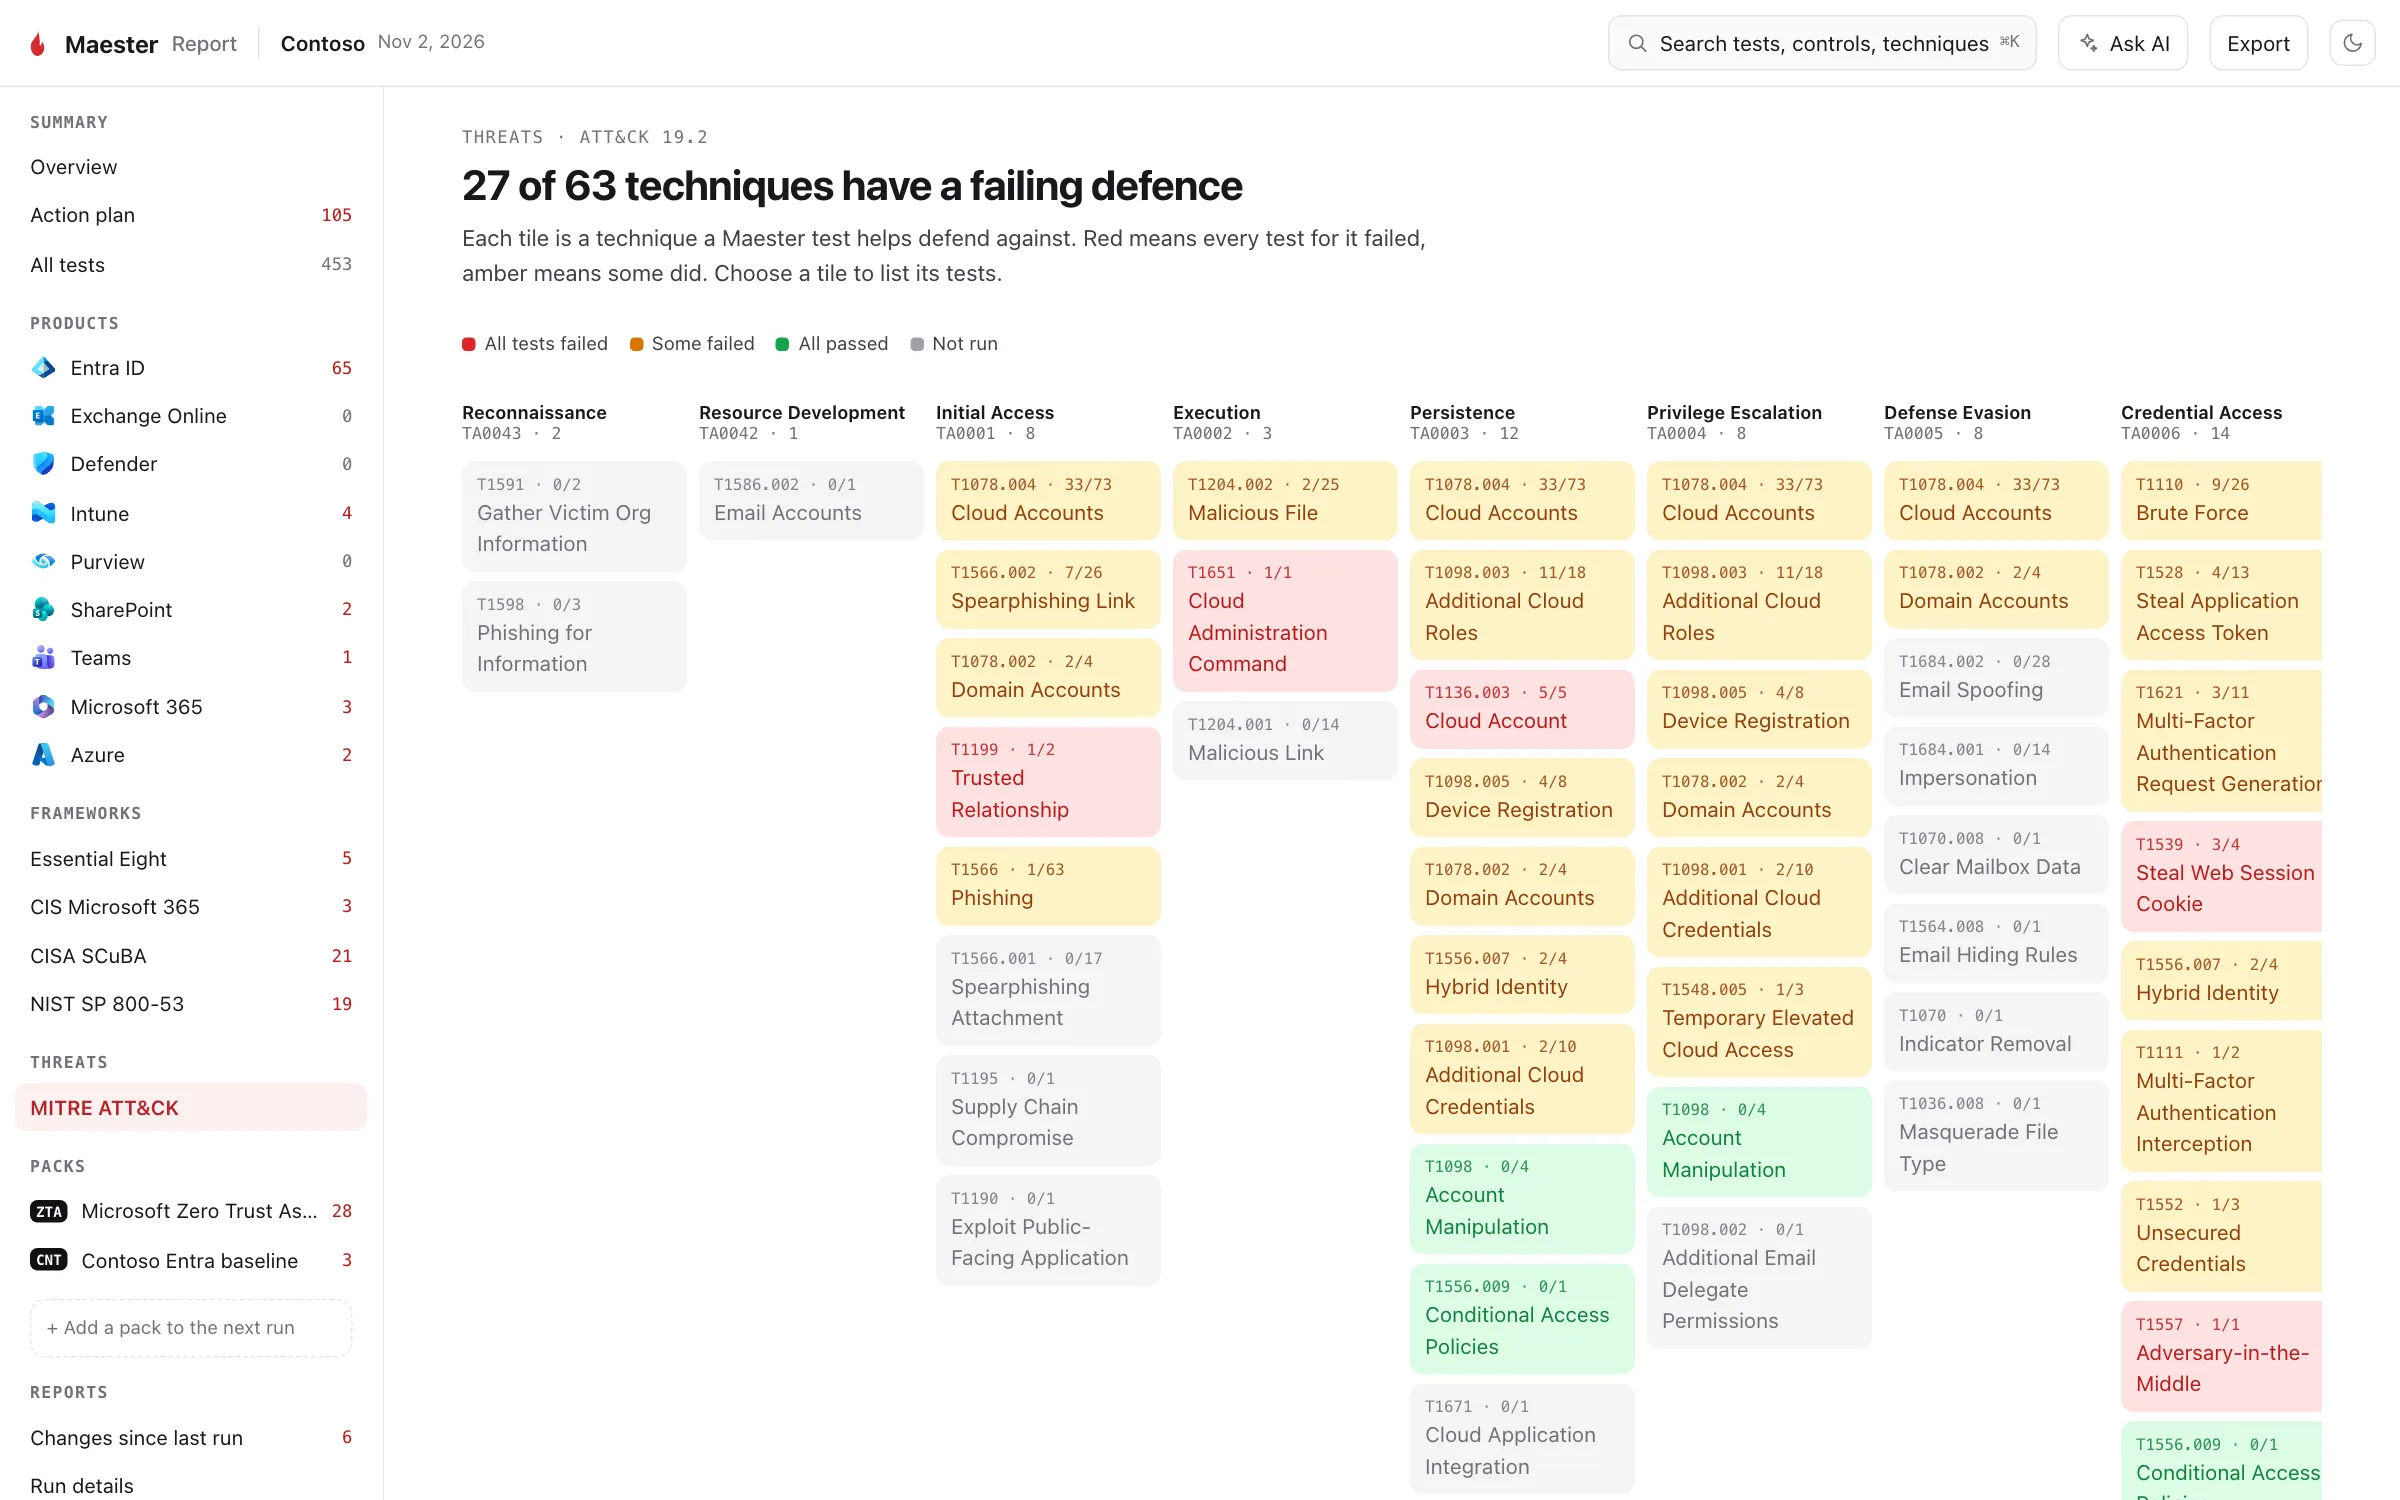
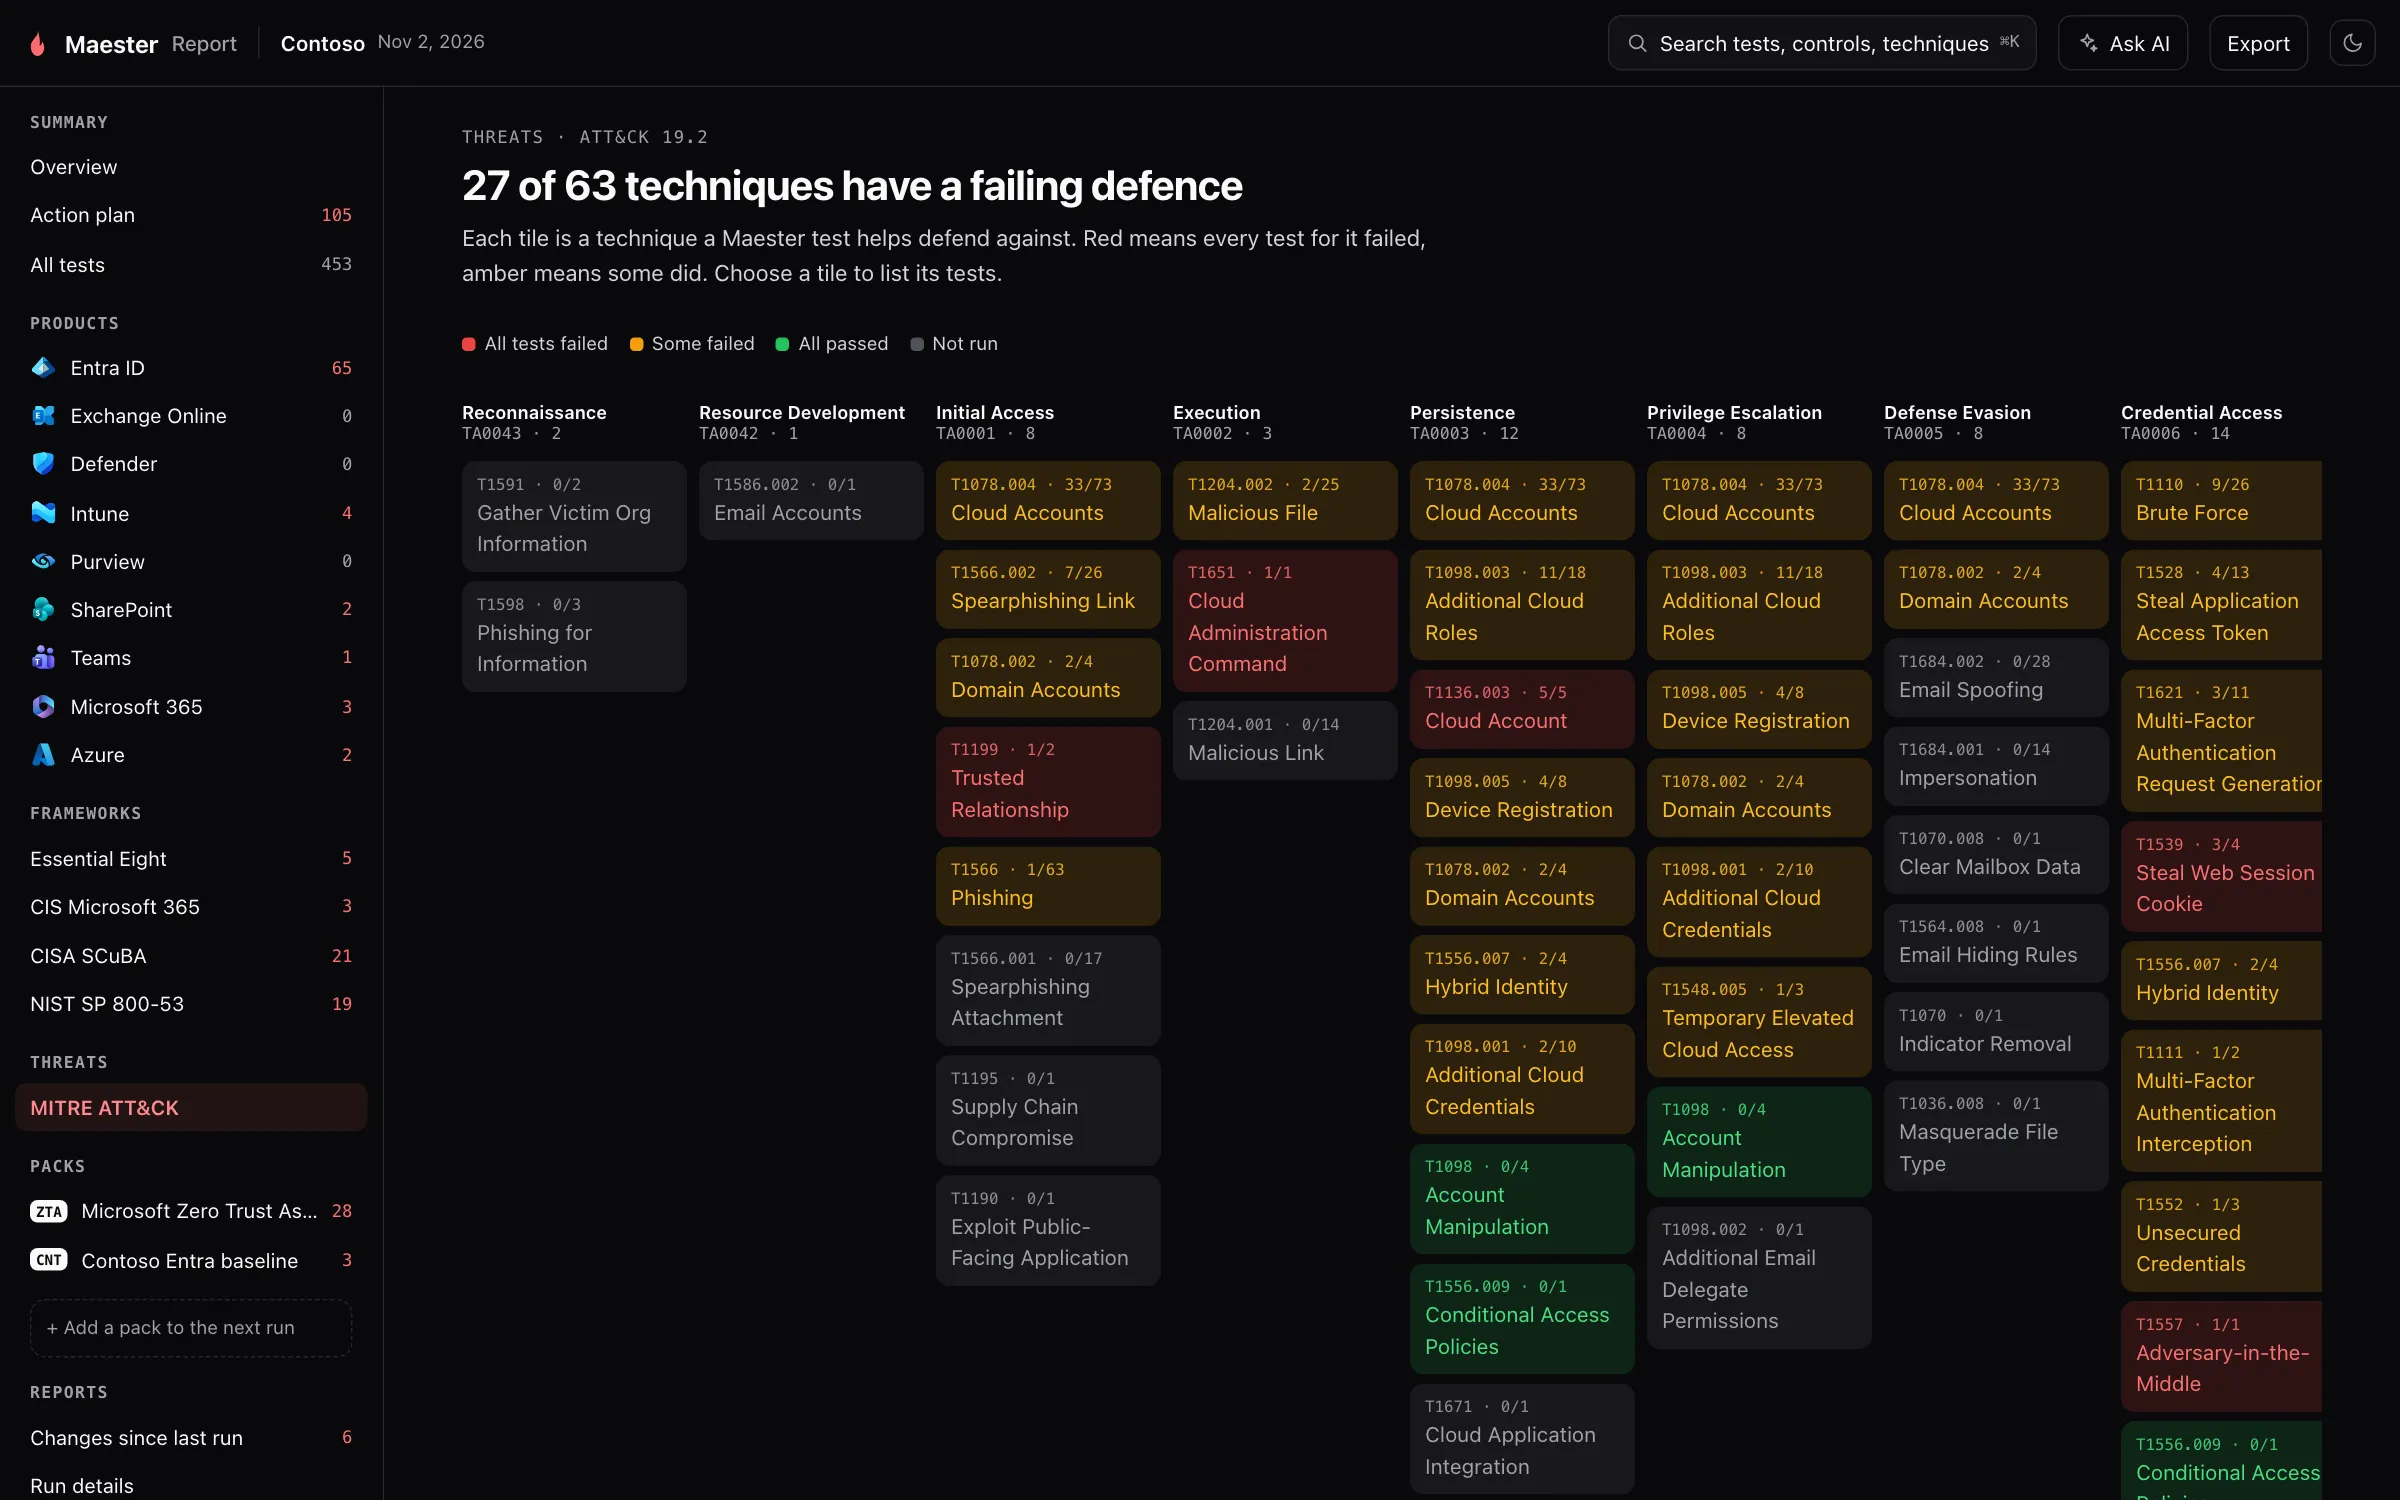
What it is for. The same results, seen by the attack technique each test helps defend against.
Why we built it. “42 checks failed” is hard to explain to someone outside the team. “Nothing stops password spraying” is not.
How it helps. Each tile is a technique, under its tactic. Red means every test for it failed, amber that some did, green that all passed. Select a tile to list its tests. If you have a threat model, or an incident you are learning from, start from the techniques that matter to you.
Each Maester Pack in the run gets its own row in the menu and its own pages: an overview, its results grouped the way the pack chooses, any reports it attached, how to set it up, and an About page with its publisher and version. A pack’s results are kept apart from Maester’s own in the menu, and are counted in the totals of the run.
Run details
Section titled “Run details”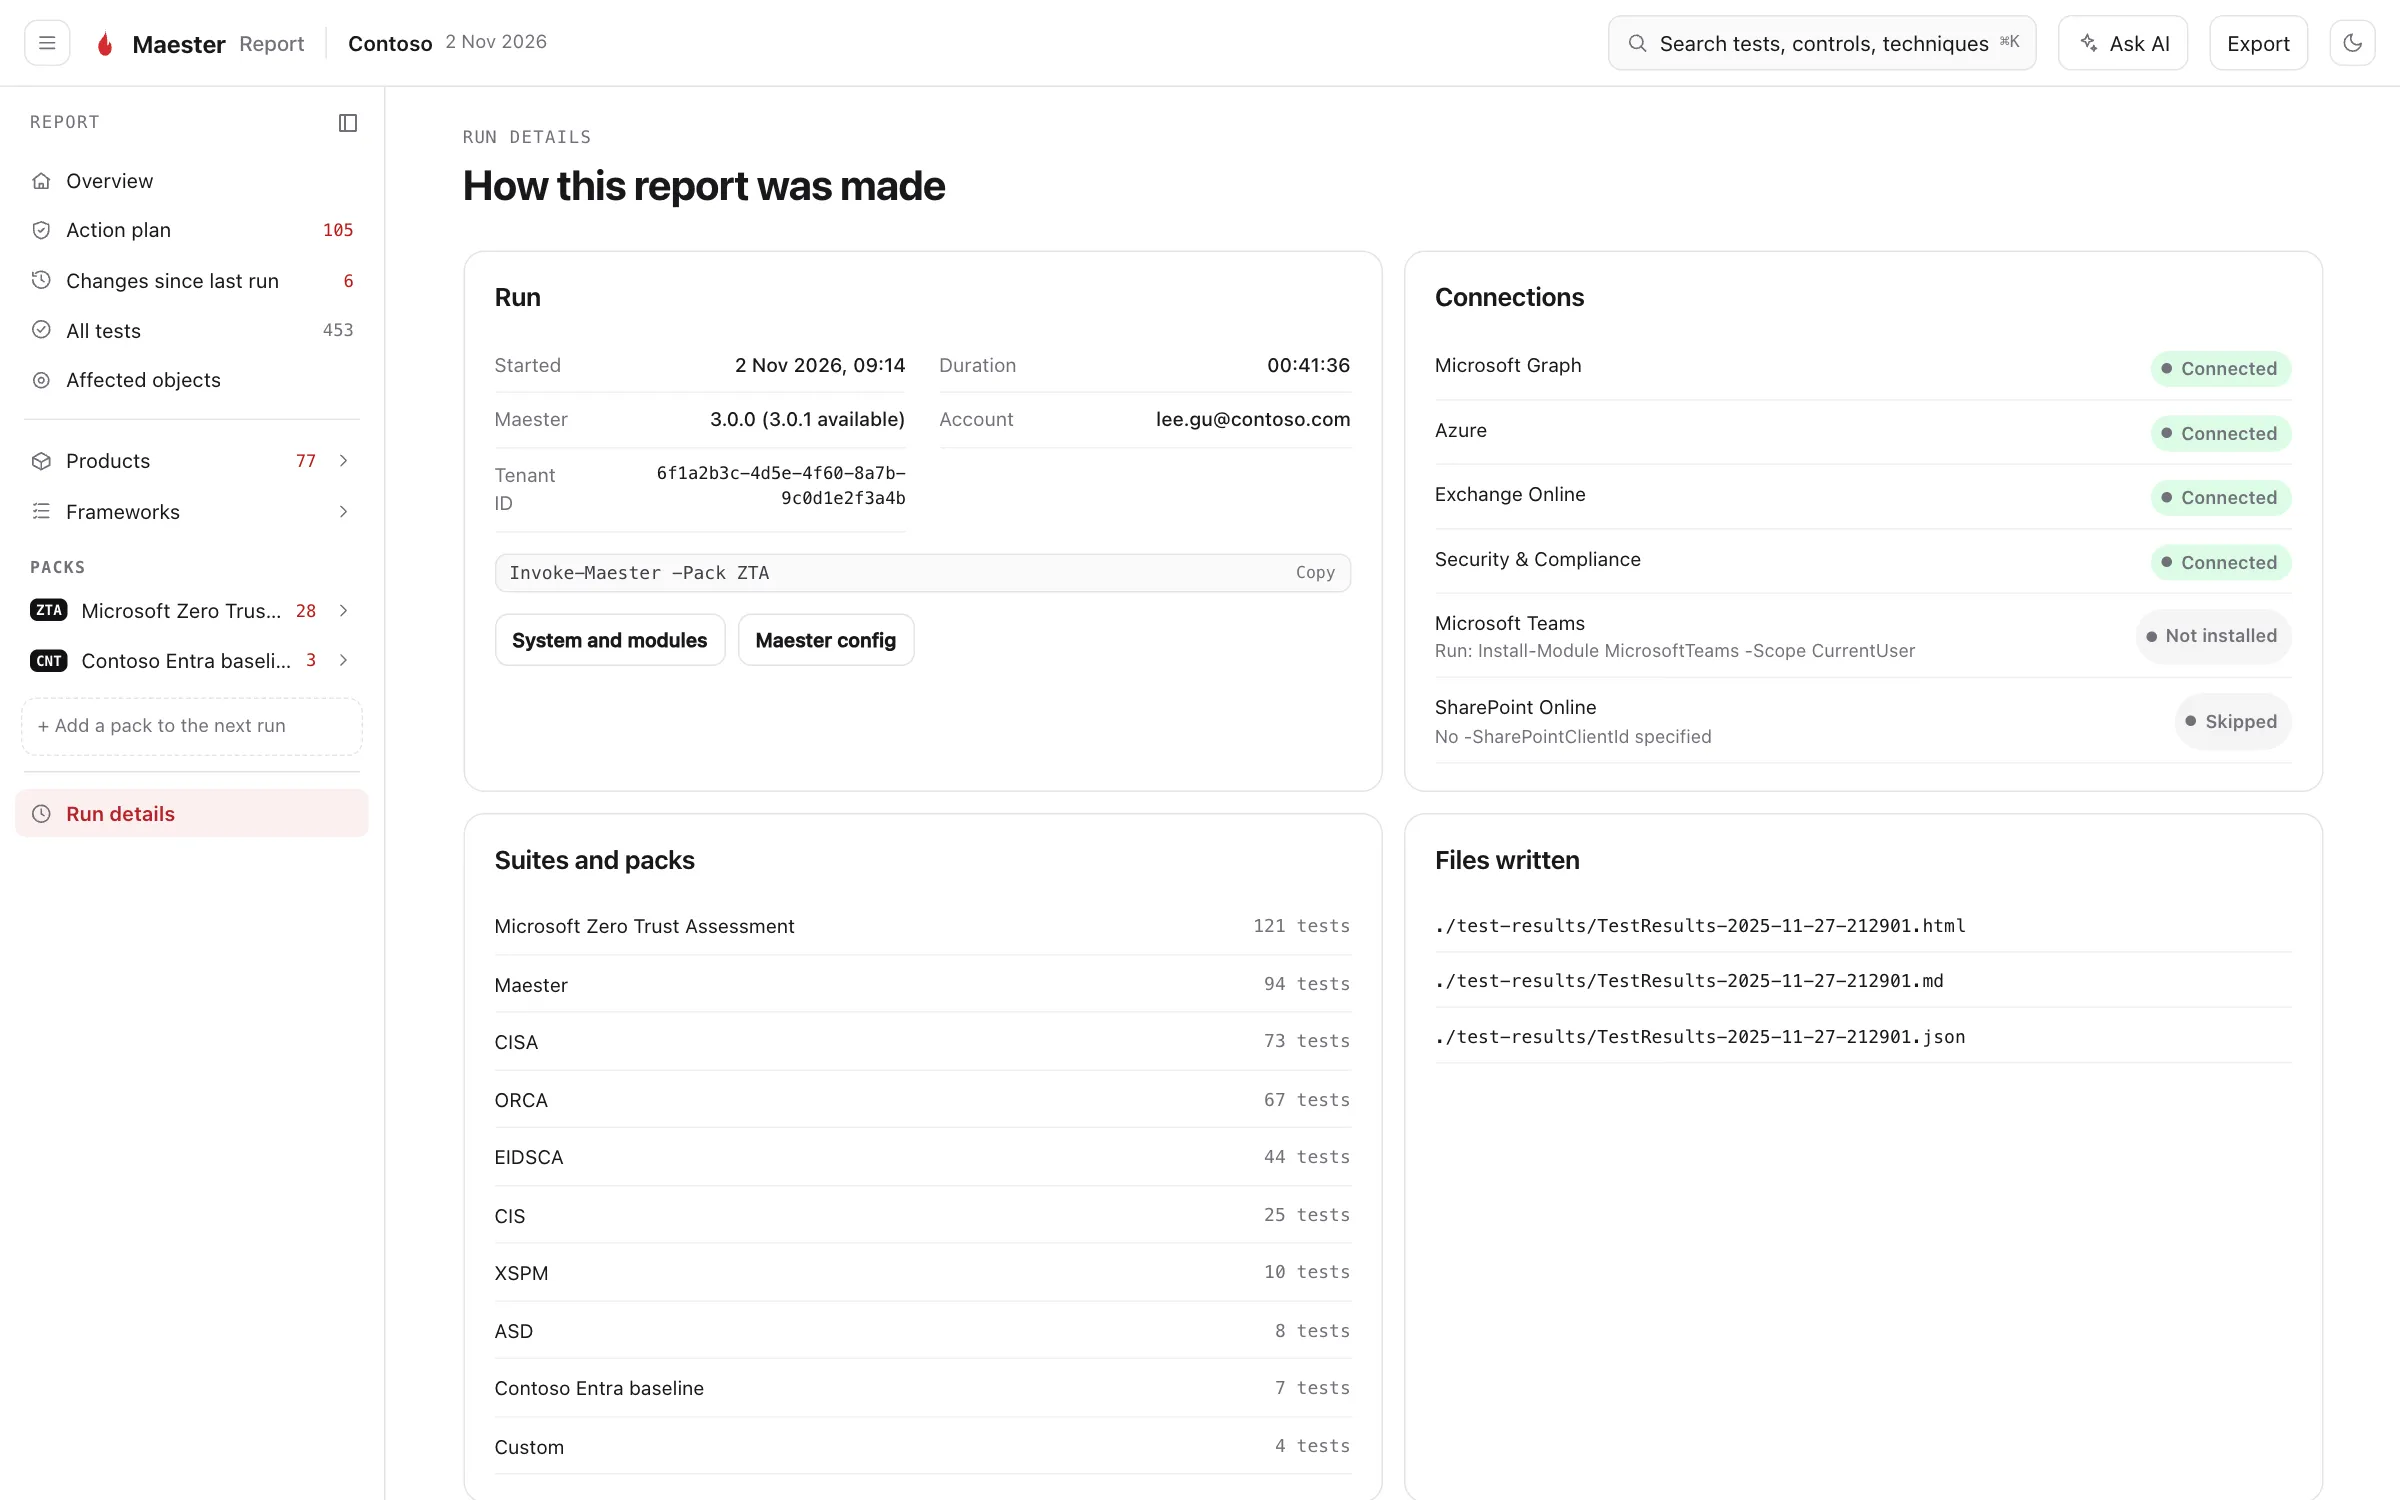
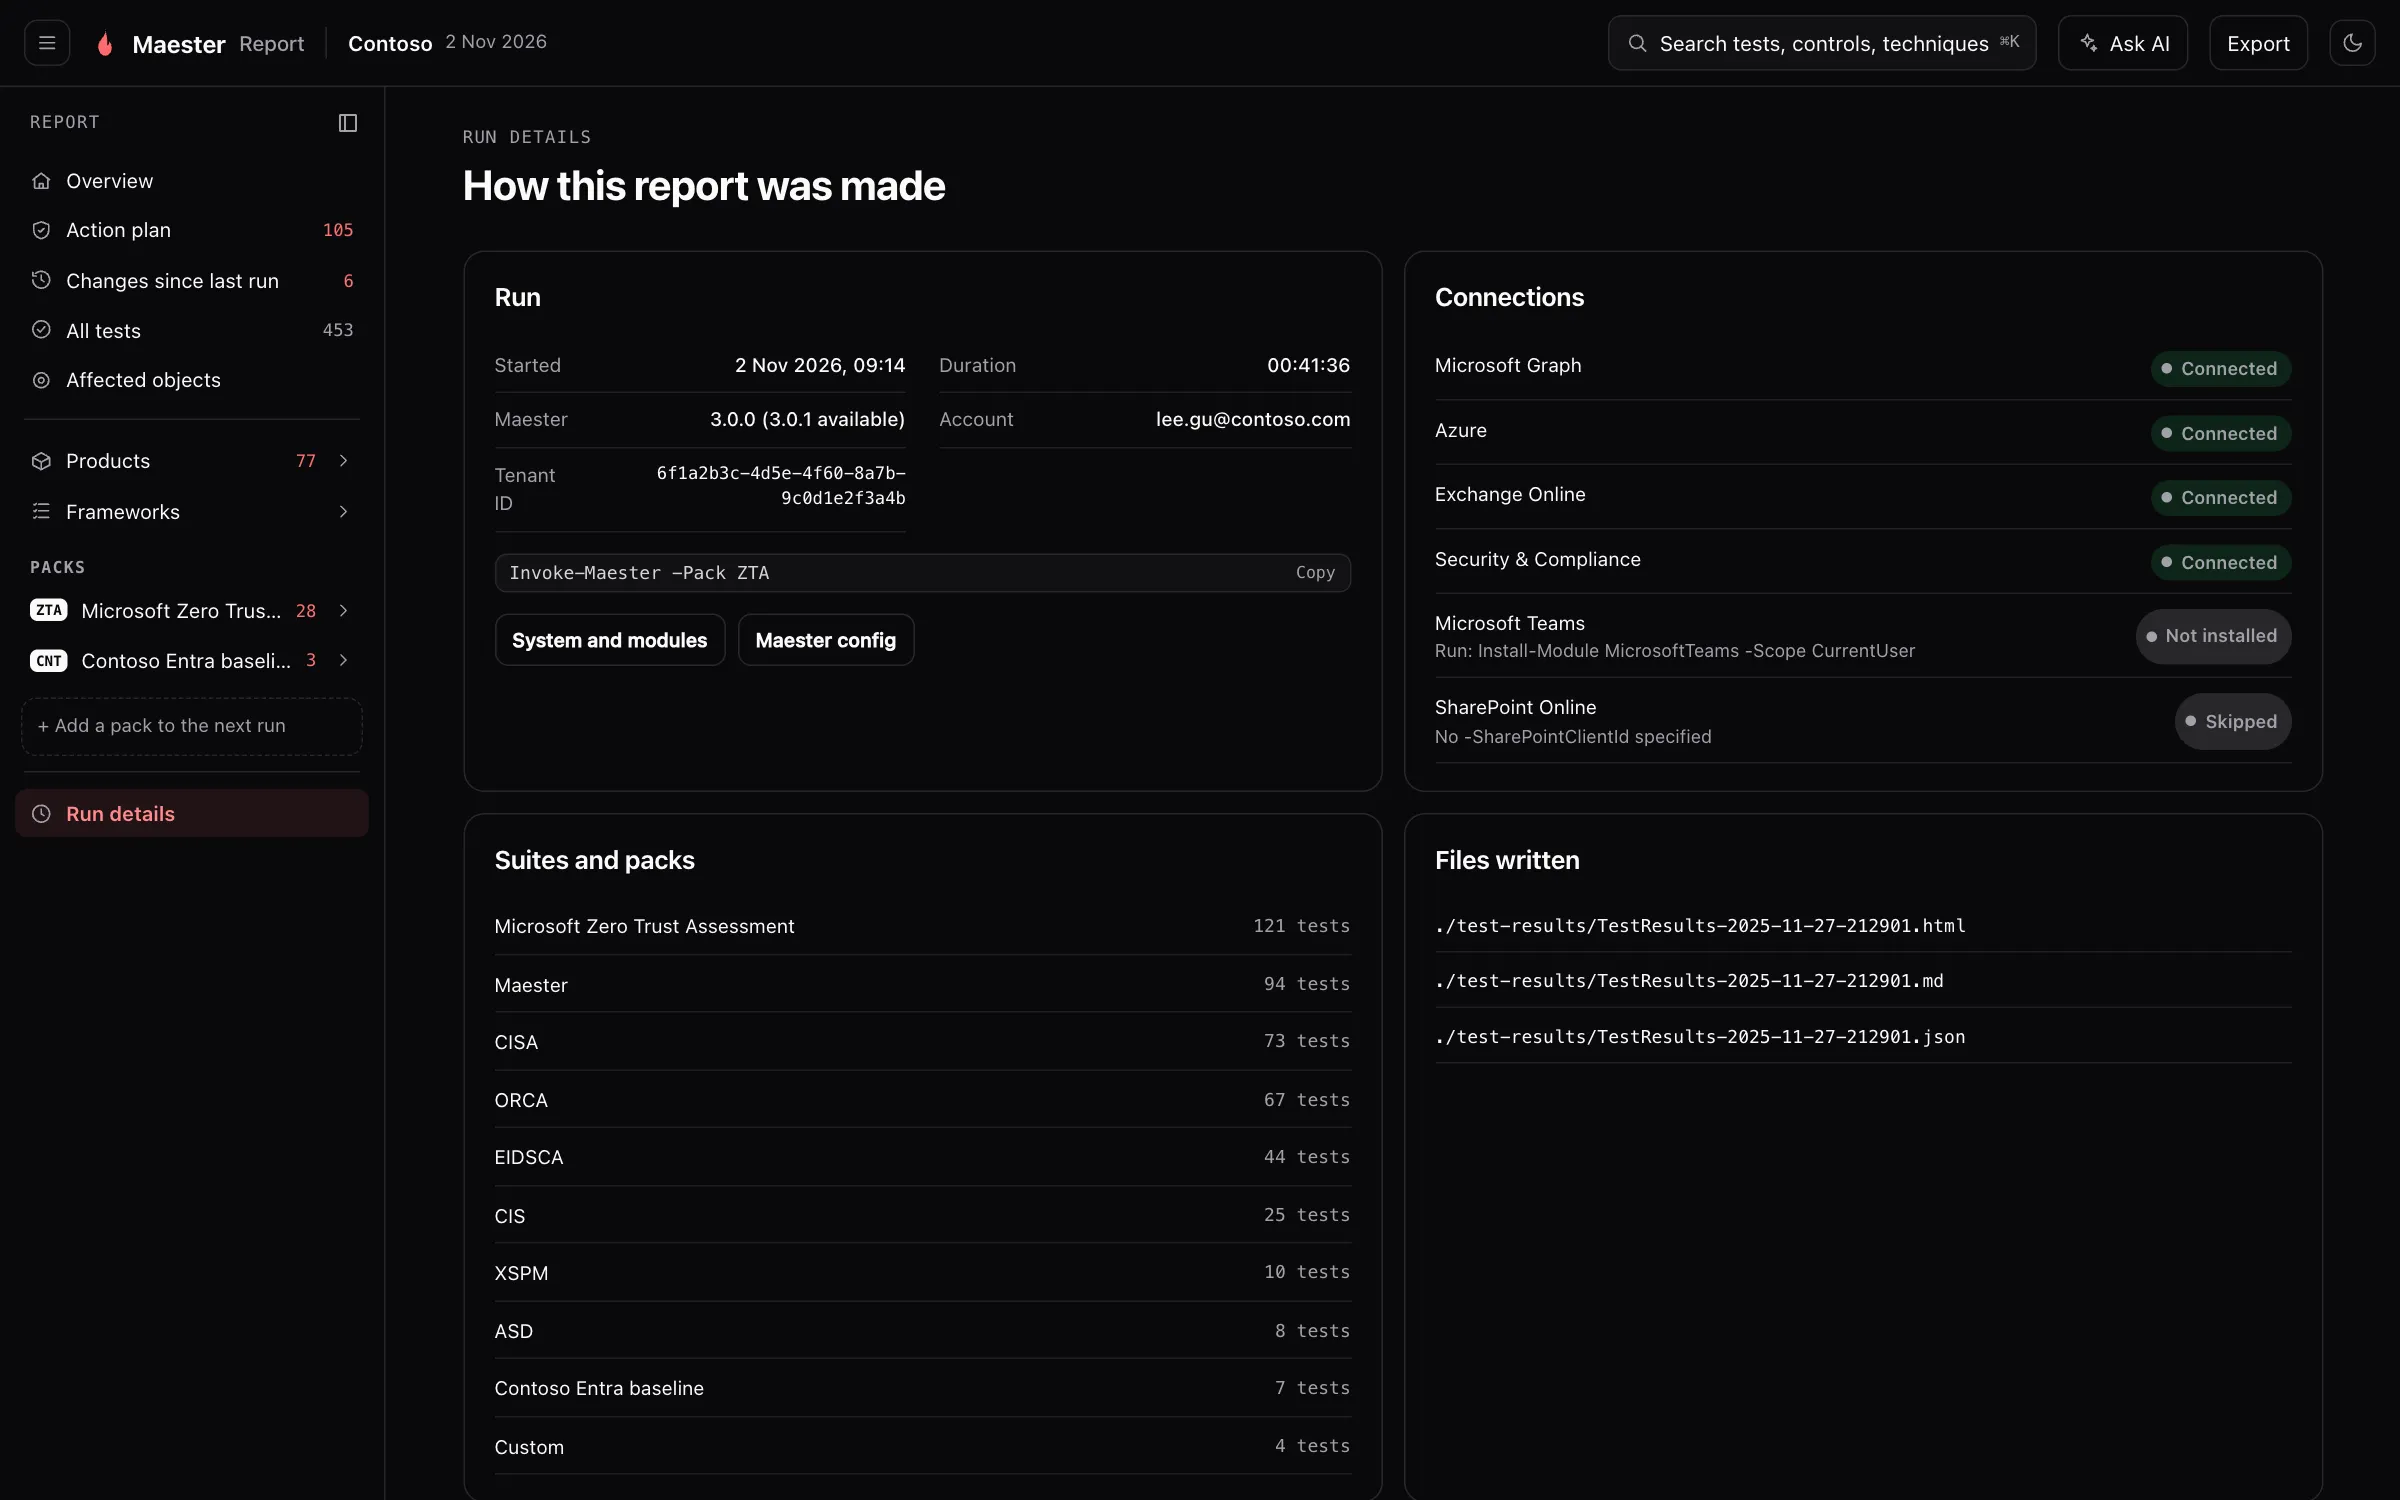
What it is for. The record of the run: when it ran, as whom, with which command and Maester version, which services were connected, how many tests came from each suite and pack, and which files were written.
Why we built it. A report is only as good as the run behind it. When a number looks wrong, or two reports disagree, this is where you find out why.
How it helps. A service that was not connected is the usual reason for tests that did not run, and the page says which ones were not and why. Maester config shows the configuration the run used, and System and modules the PowerShell and module versions, which is what to include when you ask for help.
Zero Trust
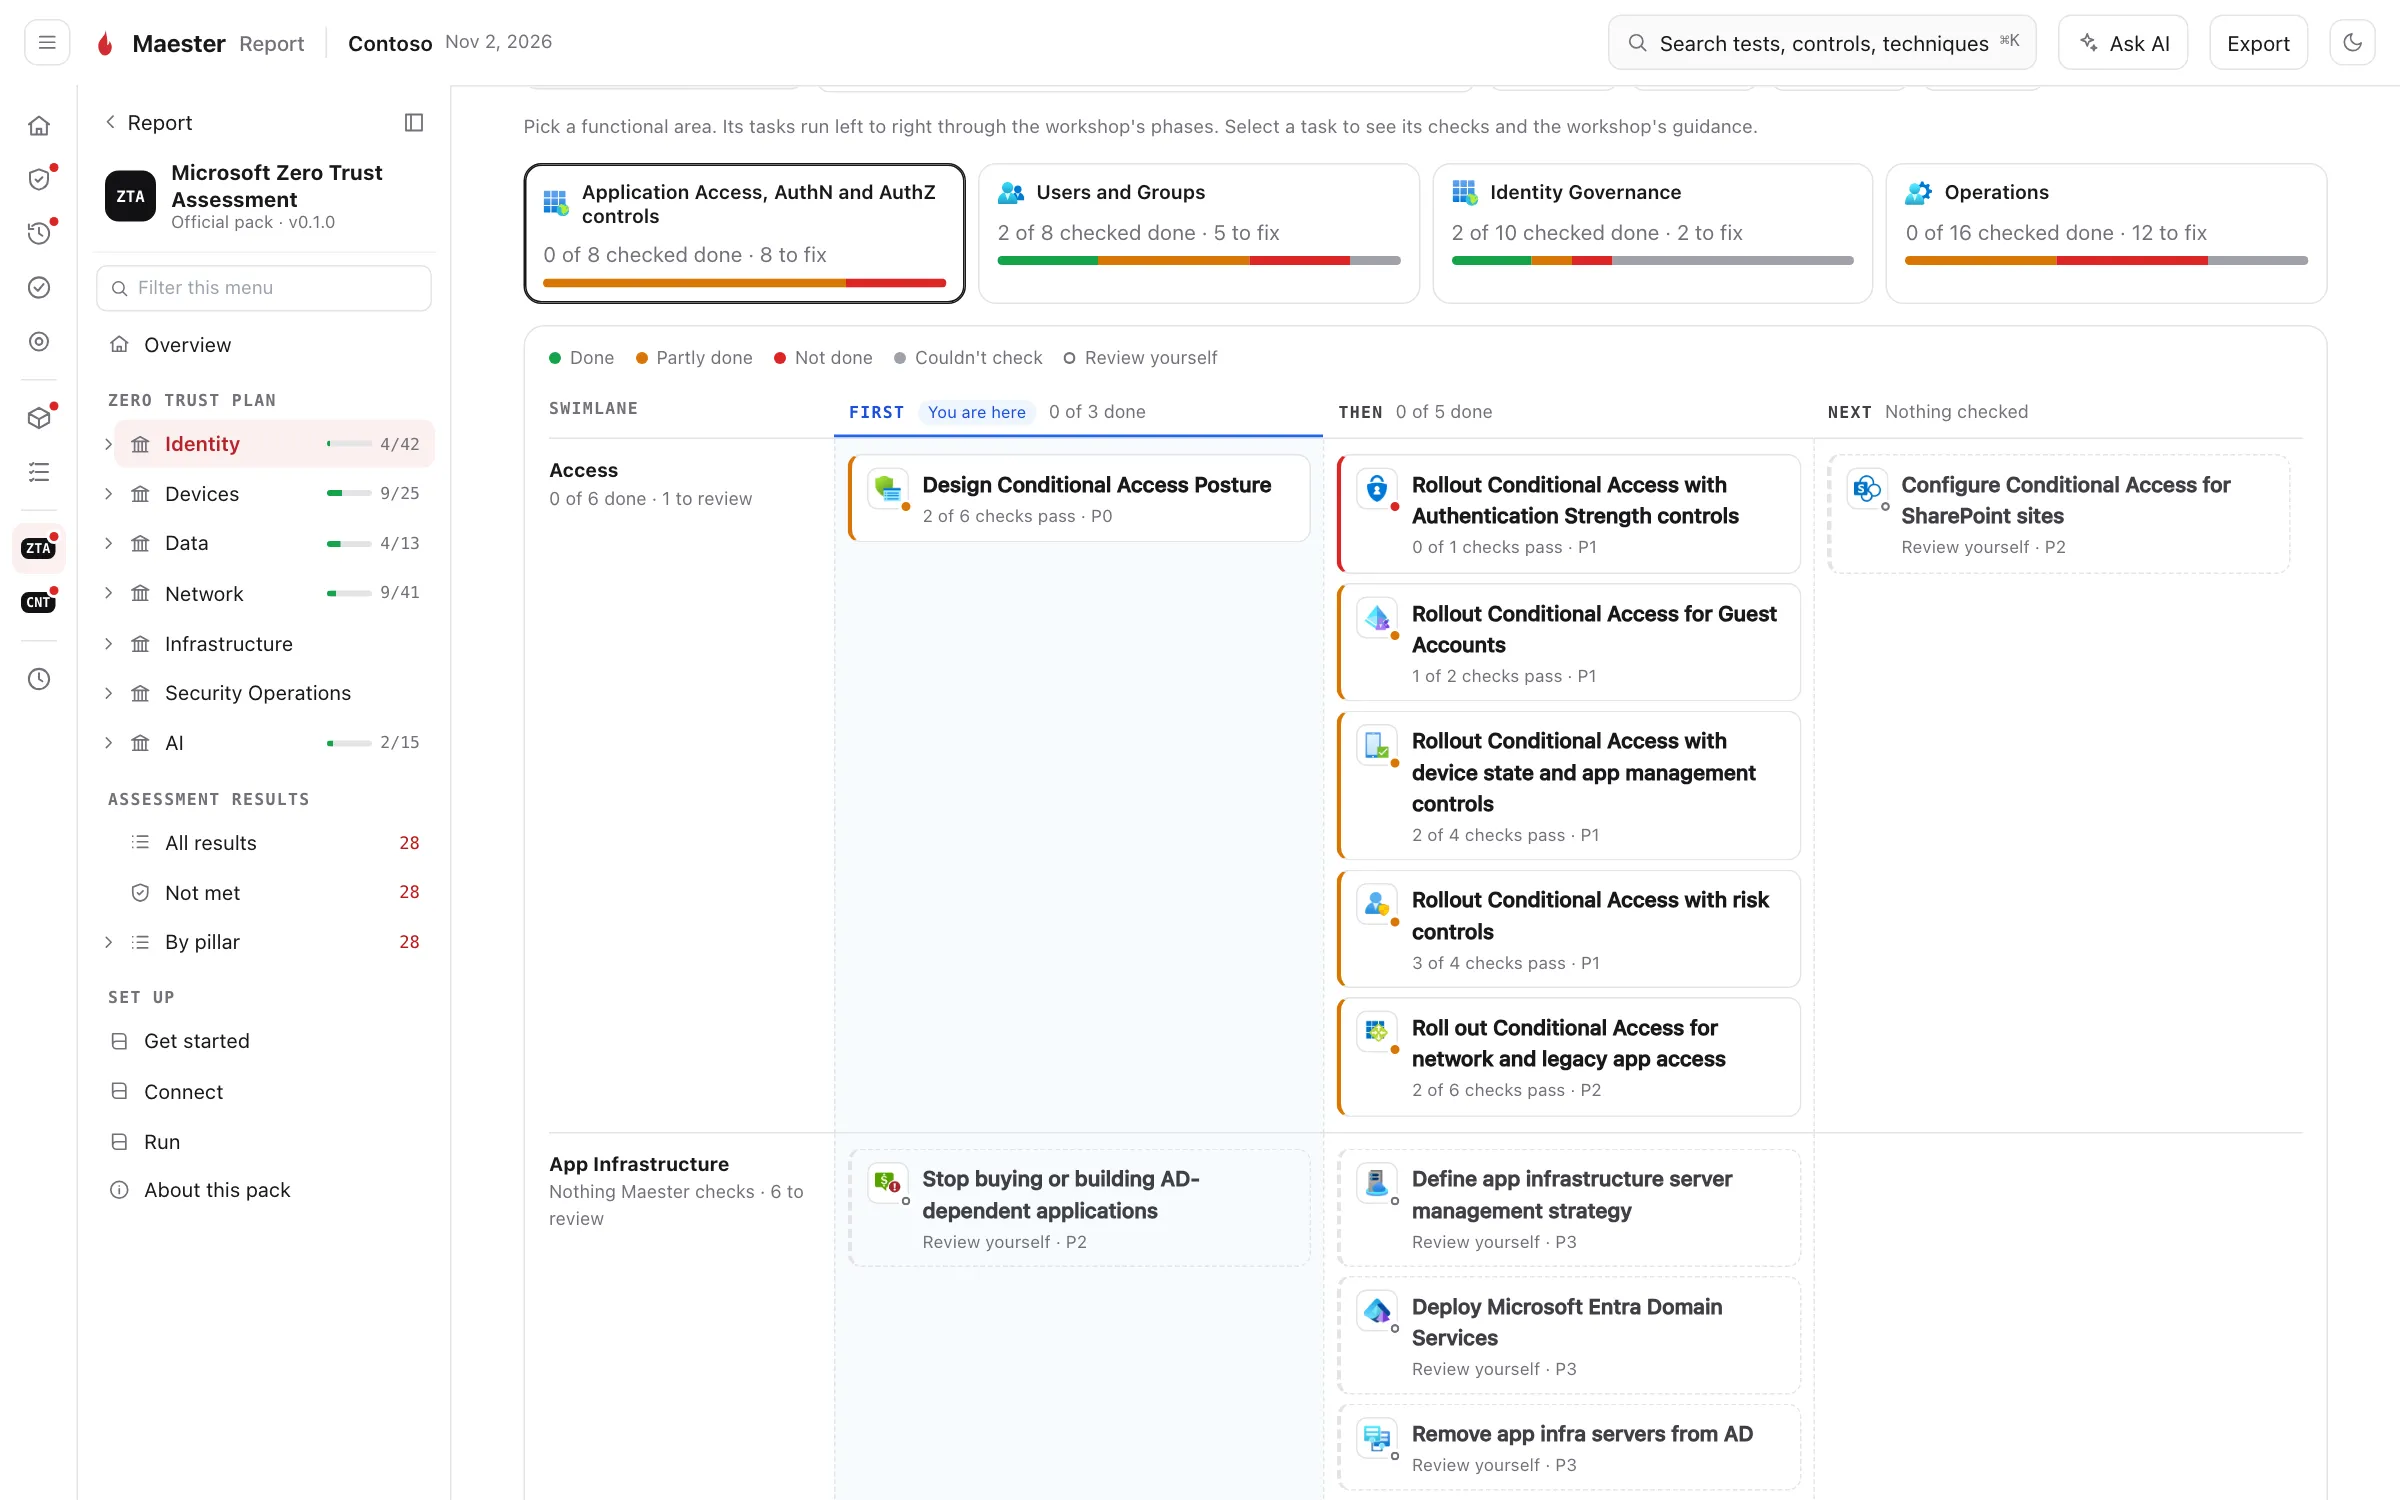
Section titled “Zero Trust”When the run includes Microsoft’s Zero Trust Assessment, the report gains a set of pages of its own: the assessment’s results by pillar, and Microsoft’s Zero Trust Workshop as a plan that shows what your tenant has already done. See Zero Trust in the report.
Many tenants
Section titled “Many tenants”When you merge the results of several tenants into one report, a Tenants page compares them: how each tenant did, each product in each tenant, and the failures that most tenants share, which are the ones to fix once for all of them. See Multi-tenant reports.